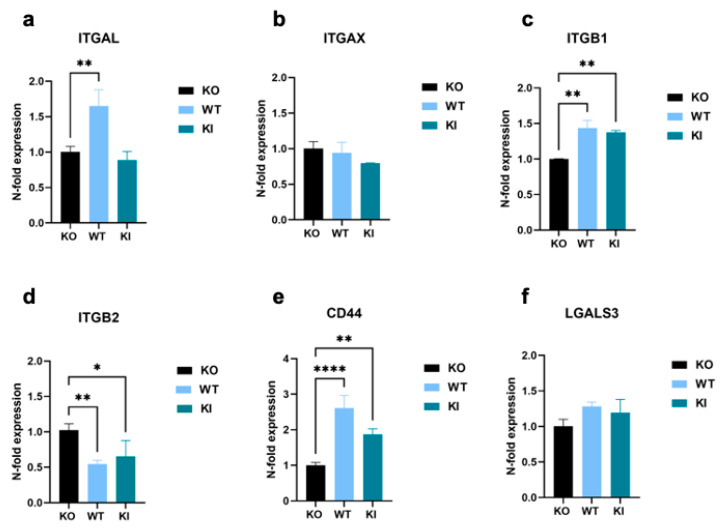
Figure 5.
Genomic expression analysis of cell-adhesion-promoting molecules in THP-1 WT, KI, and KO cells. (a–e) Real-time qPCR showing relative expression levels of (a) ITGAL, (b) ITGAX, (c) ITGB1, (d) ITGB2, (e) CD44, and (f) LGALS3 calculated according to the comparative CT method (2−ΔΔCT). Bar graphs show mean values ± standard deviation (n = at least 4). One-way ANOVA, followed by Dunnett’s multiple comparison test, was performed to assess differences between KO, WT, and KI cells (* p < 0.05; ** p < 0.01; **** p < 0.0001).

