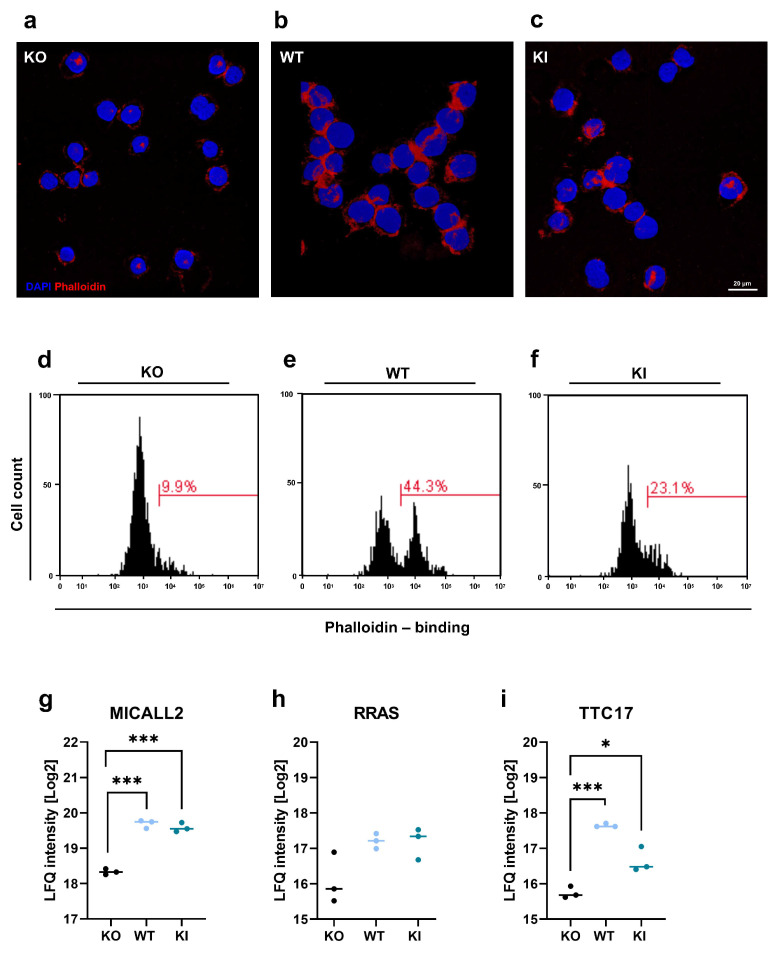
Figure 6.
Actin organization in THP-1 WT, KI, and KO cells. (a–c) After harvesting THP-1 WT, KI, and KO cells, they were stained with phalloidin conjugated to AlexaFluor 635 to visualize F-actin (red), and cell nuclei were stained with DAPI (blue). The scale bar represents 20 µm. (d–f) Cells were harvested and stained with phalloidin and analyzed by flow cytometry. Histograms show phalloidin-binding in THP-1 KO, WT, and KI cells. (g–i) Protein signature characteristic for THP-1 WT, KO, and KI cells (n = 3) of (g) MICAL-like protein 2 (MICALL2), (h) Ras-related protein R-Ras (RRAS), and (i) Tetratricopeptide repeat protein 17 (TTC17). Interleaved scatter plots show multi-parameter corrected significant protein regulations (FDR = 0.05, S0 = 1). Statistical significances and p-values correspond to the statistical tests underlying the volcano plots and are listed in Table S1 (* p < 0.05; *** p < 0.001).

