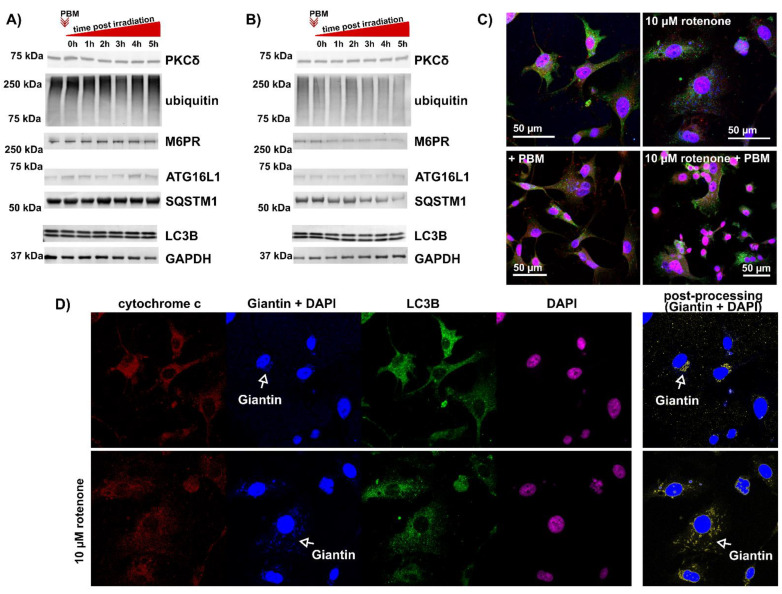
Figure 2.
Evidence of autophagy observed in U87MG cells treated with PBM. (A) Total protein lysate is collected immediately or 1–5 h after PBM. (B) Cells exposed to rotenone for 24 h and then treated with PBM. The total protein lysate is collected immediately or 1–5 h after PBM. (C) Representative fluorescence images of cells exposed to PBM and rotenone and immunolabeled with antibodies against cytochrome C (red), giantin (blue), and LC3B (green). Cell nuclei are labeled with DAPI (blue and pink). The representation of each channel is shown in (D). White arrows mark the position of the Golgi apparatus. Giantin and DAPI images are subjected to postprocessing (subtraction of DAPI image from Giantin + DAPI image) to highlight the Golgi apparatus in yellow.

