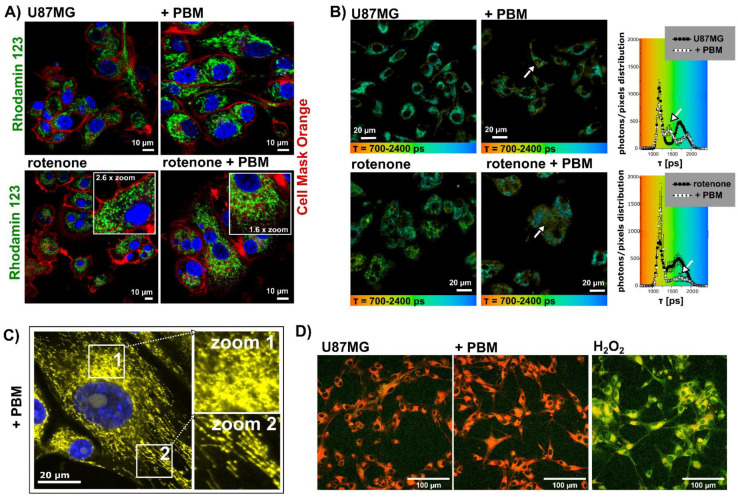
Figure 3.
Representative fluorescence images of U87MG cells treated with PBM, rotenone, and rotenone+PBM, (A) labeled with Rhodamine123 (green, mitochondria), Cell Mask Orange (red, plasma membrane), and Hoechst (blue, cell nuclei), and (B) FLIM images of MitoTracker Orange CMTMRos and distribution histograms of its fluorescence lifetime in the cells. The arrows point to changes due to PBM. (C) Distribution of the mitochondria in cells treated with PBM (MitoTracker Orange CMTMRos in yellow, cell nuclei are marked with Hoechst in blue). Zoom 1 shows mitochondrial clouds and oxidative stress characterized by the diffuse distribution of the fluorescent probe. Zoom 2 shows fused long fibrillar mitochondria. (D) Representative images of cells exposed to PBM and H2O2 labeled with a fluorescent probe (ab243377) sensitive to lipid peroxidation, shown by a color change from red to green.

