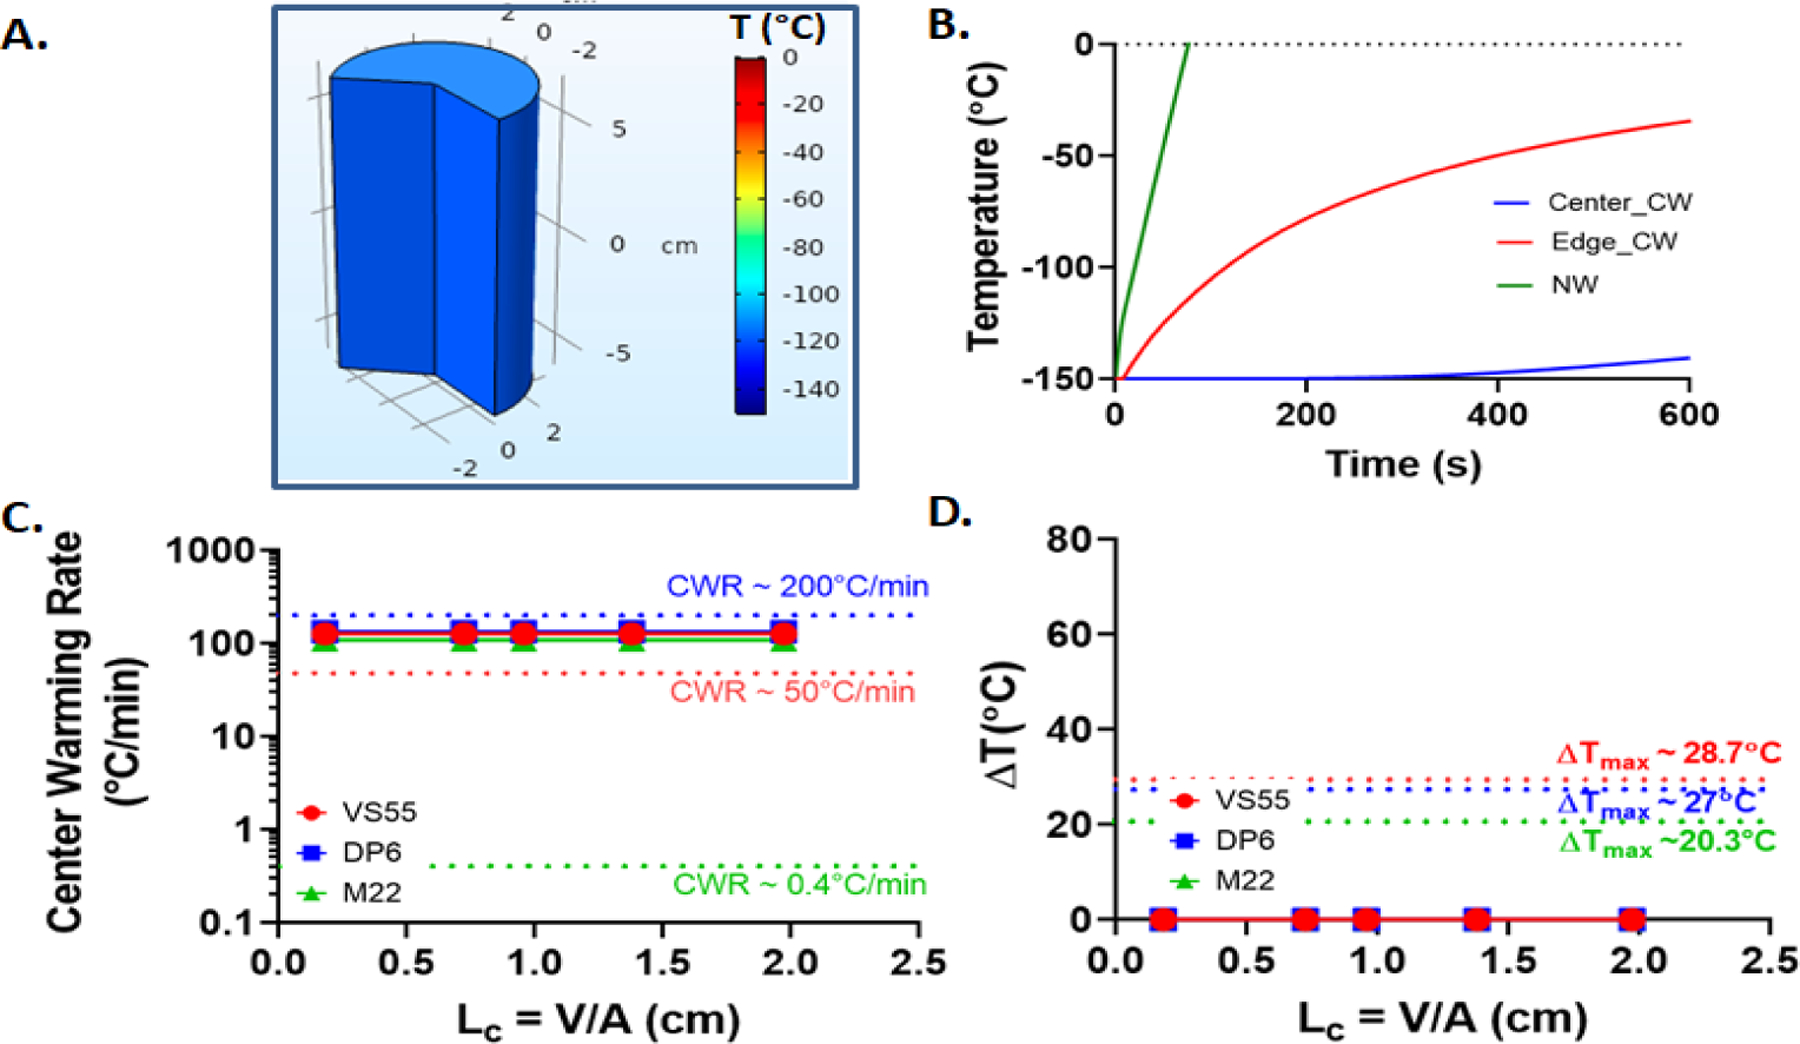
Figure 5.

Nanowarming. For a representative case of LC = 1.38 cm (or 500mL) M22 system (A.) Temperature distribution inside the geometry around Tg (~120°C). (B.) Nanowarming temperature curve compared to convective warming. (C.) Center warming rate variation with characteristic length of geometry for all the three CPAs. (D.) Plot of temperature difference (ΔT) with characteristic length (LC) of geometry.
