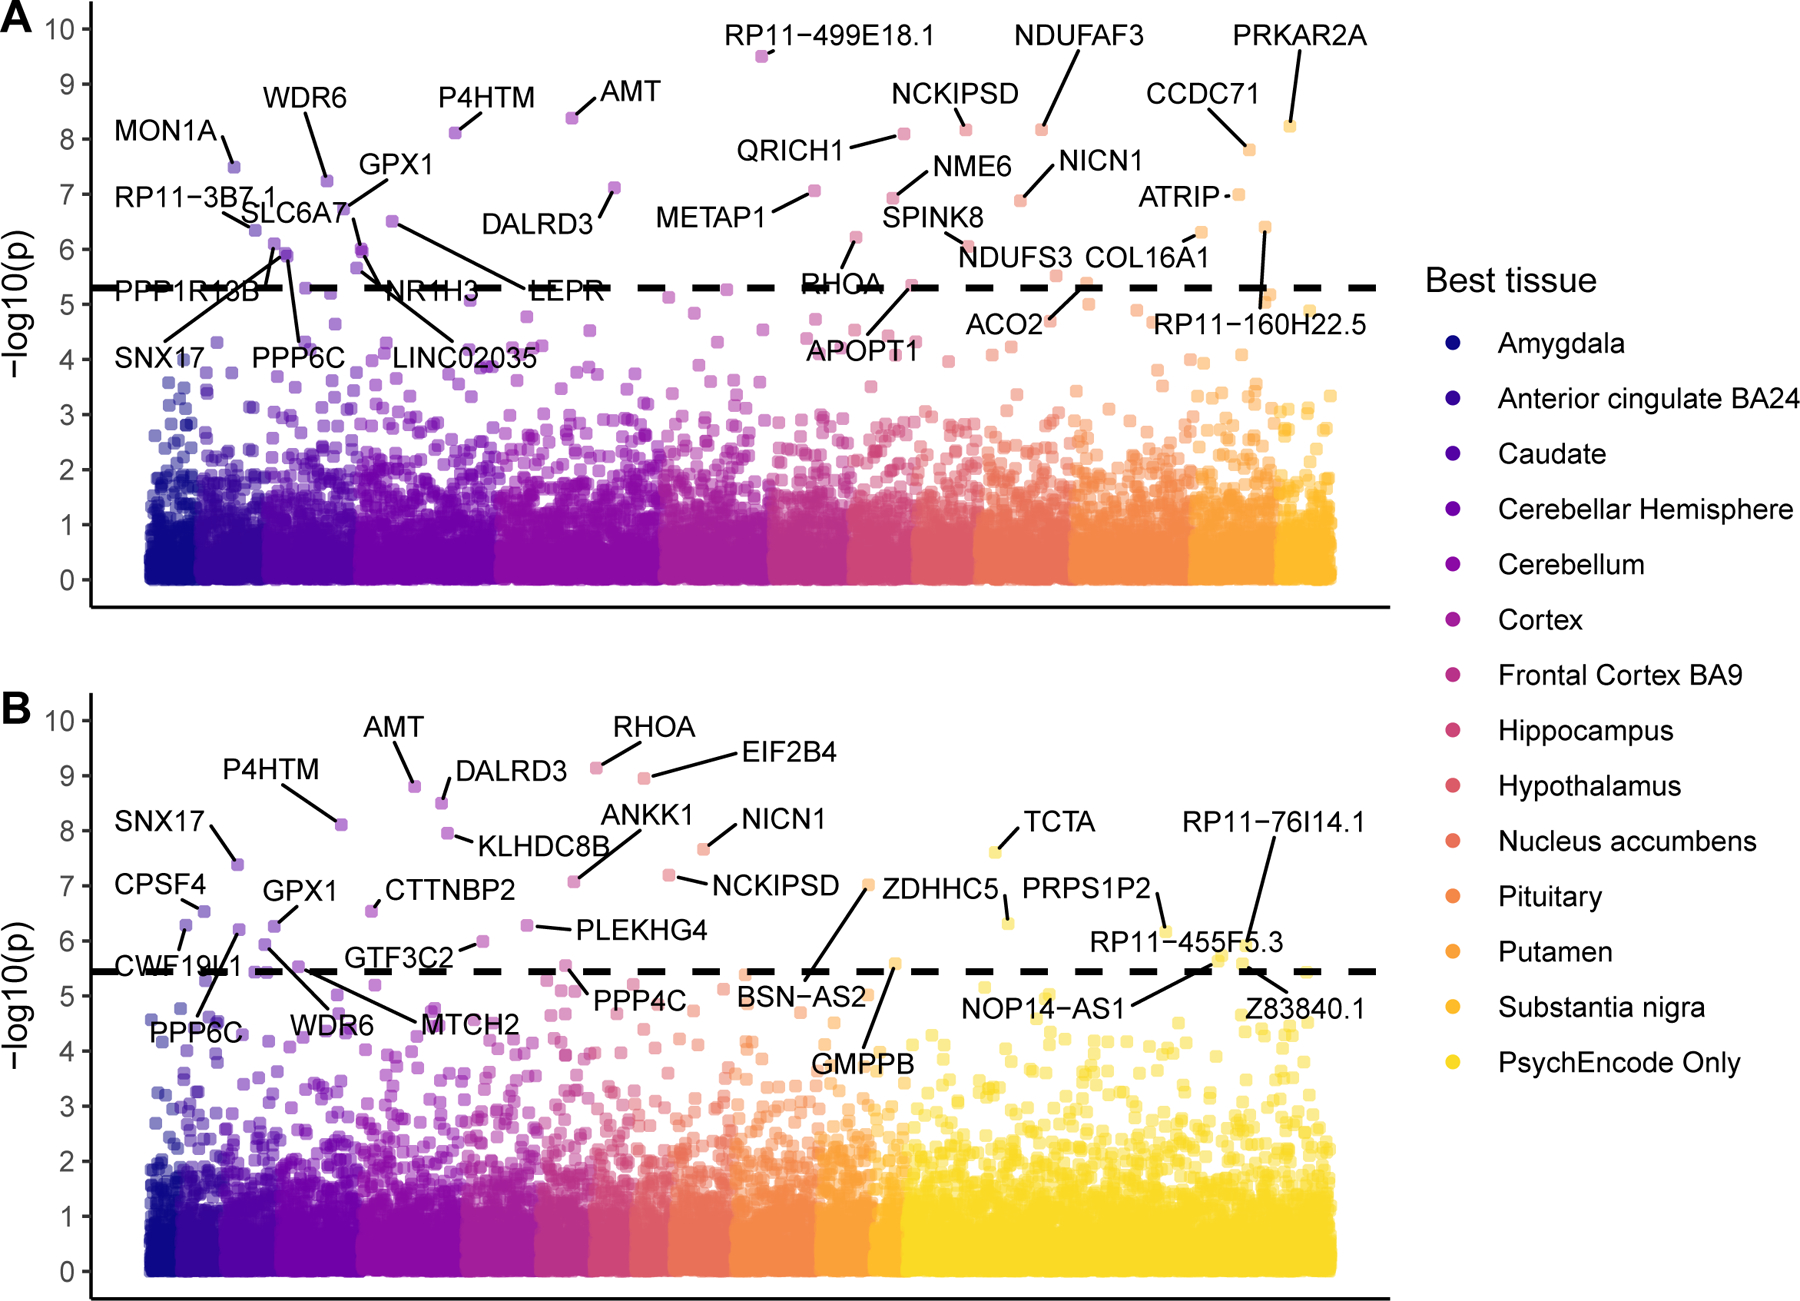
Figure 2. Manhattan Plot of TWAS Results for Addiction-rf.

A Transcriptome-Wide Association Study (TWAS) of the addiction-rf, plotted as a Manhattan plot. In Panel A, Analyses were conducted in S-MultiXcan with GTeX v8 data. In Panel B, the analysis was run using S-PredixCan with weights trained from PsychEncode. The y-axis is presented as −log10(p), the color of the data point represents the tissue in which correlation between gene expression and outcome was the highest. The dotted black line represents Bonferroni corrected TWAS significance of a two-sided test (Plot A has 9,944 genes, Bonferroni = 5×10^-6 and the line is at 5.3, Plot B has 13,850 genes, Bonferroni = 3.6×10^-6, line is at 5.4)
