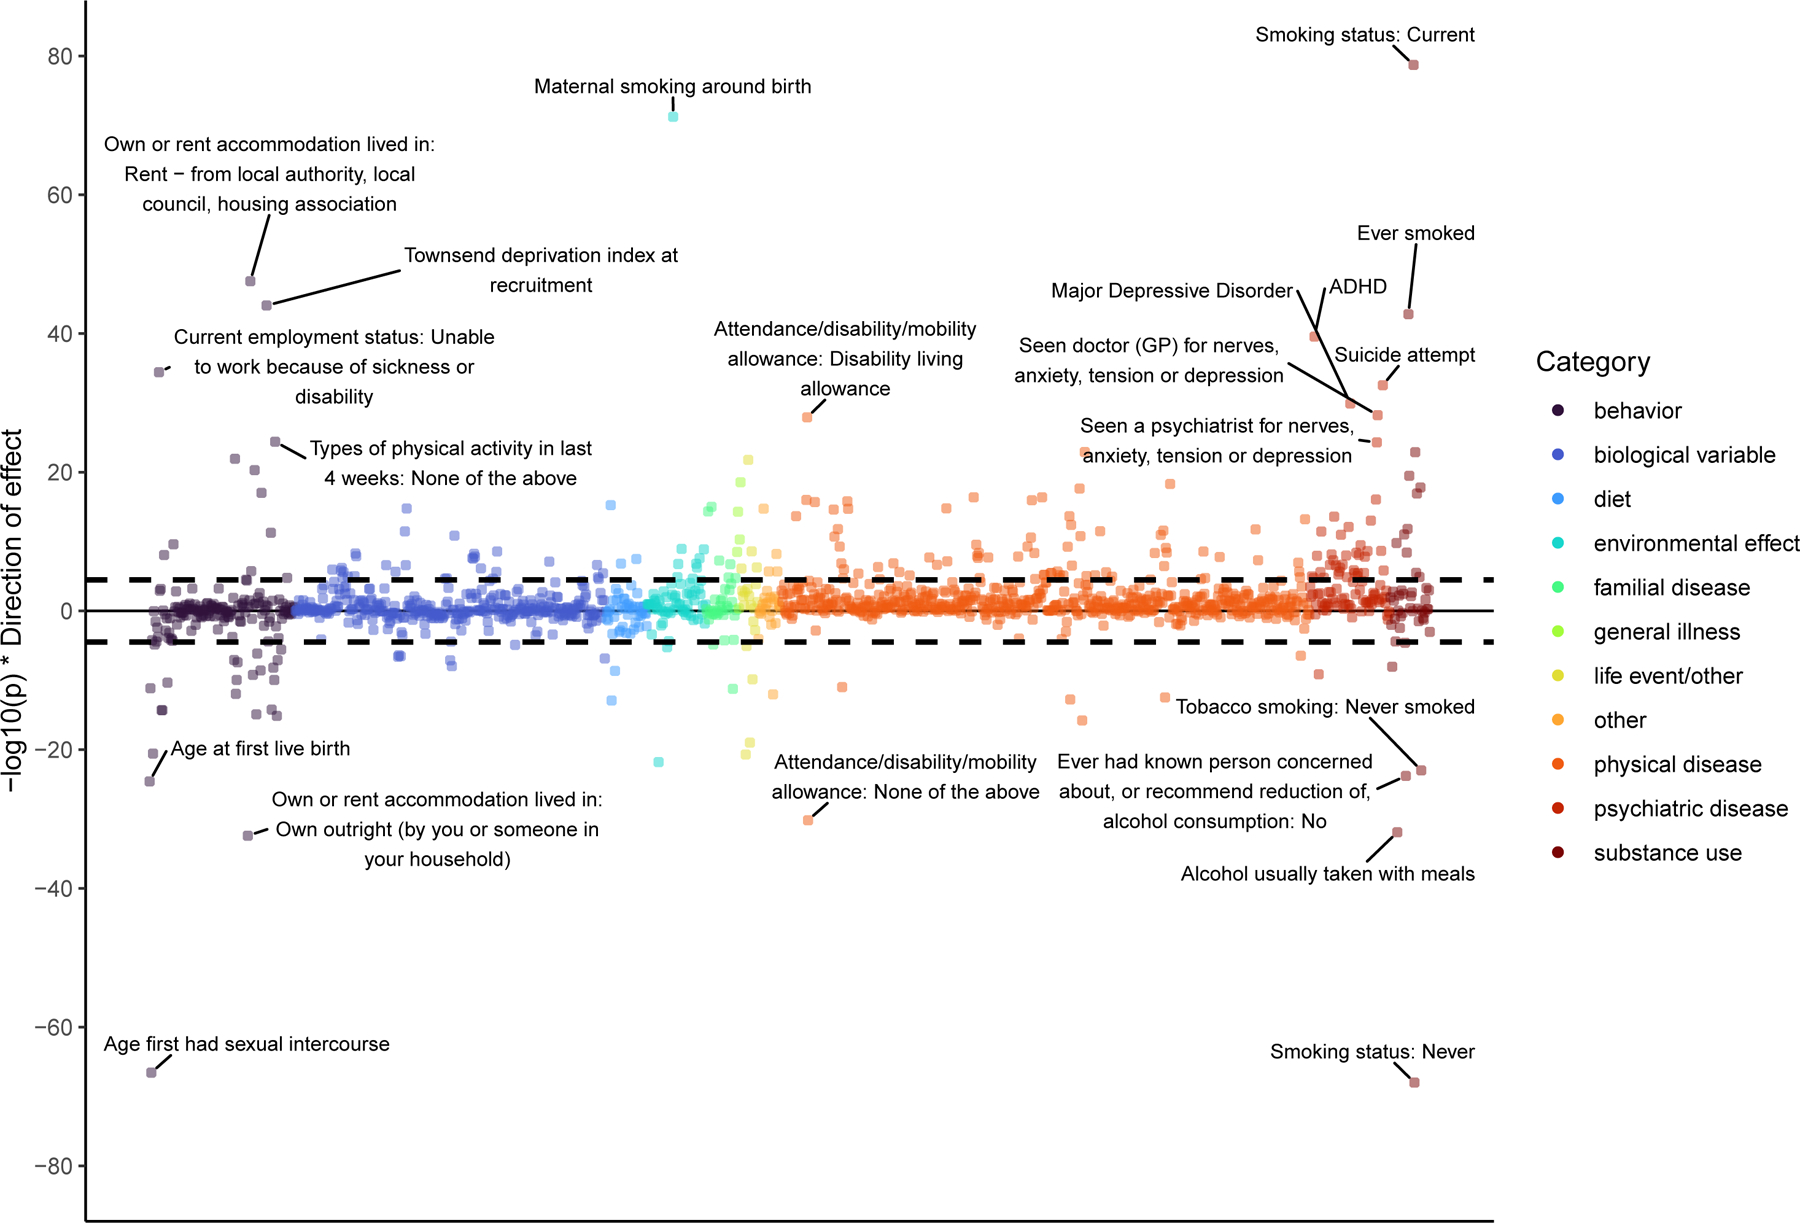
Figure 3. PheWAS of Genetic Correlations using MASSIVE.

Genetic correlations between 1,547 traits and the addiction-rf, calculated in MASSIVE, mapped by their statistical significance (-log10(p) on the y-axis), and broad category. The top 20 correlations are annotated. The black dashed line represents Bonferroni significance for association of a two-sided test (pbon= .05/1,574 = 3.232e-05).
