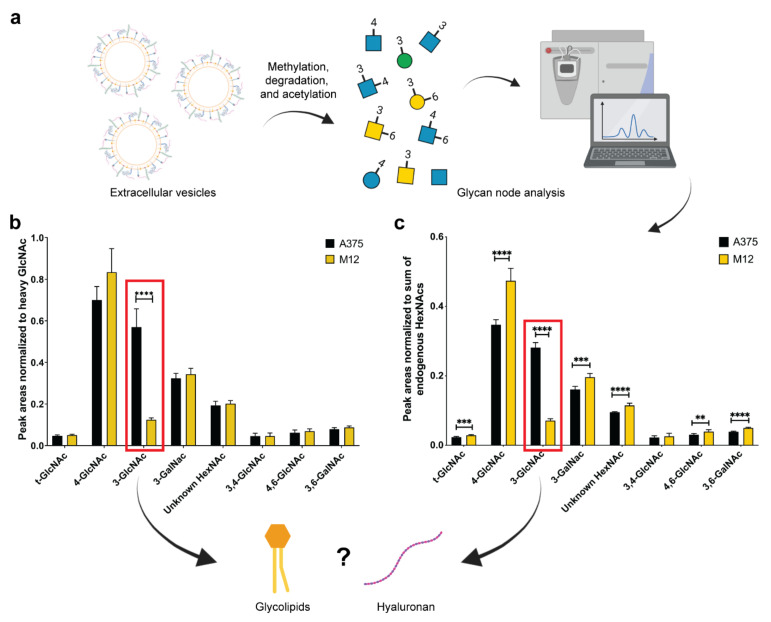
Figure 3.
Glycan node analysis of EVs from human A375 melanoma cells and human M12 melanoma brain metastases cells. (a) Schematic representation of EV glycan node analysis. (b) Peak areas normalized to heavy N-acetylglucosamine. (c) Peak areas normalized to the sum of endogenous N-acetylhexosamines (HexNAcs). Red squares highlight significant changes in 3-linked N-acetylglucosamine (3-GlcNAc). All data are presented as the mean ± standard deviation (SD) of six replicates. For each glycan node, differences between EV subtypes were searched for with a Student’s t-test, using the two-stage linear step-up procedure of Benjamini, Krieger, and Yekutieli, with Q = 0.1% to correct for false discoveries. **, p < 0.01; ***, p < 0.001; ****, p < 0.0001.

