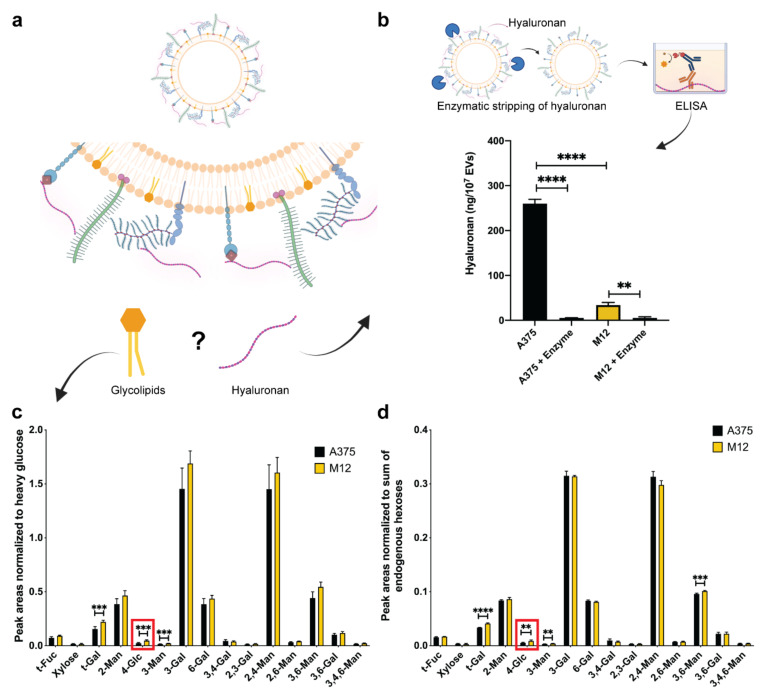
Figure 4.
Validation of the origin of 3-GlcNAc changes in EVs from human A375 melanoma cells and human M12 melanoma brain metastases cells. (a) Schematic representation of extracellular vesicle-associated hyaluronan and glycolipids as potential sources of 3-GlcNAc. (b) Enzyme-linked immunosorbent assay (ELISA) measurements of hyaluronan levels with and without enzymatic digestion with hyaluronidase. Data represent the mean + SD of triplicates. Statistical analysis was performed by ANOVA with post-hoc pairwise comparisons calculated with a Sidak’s test. **, p < 0.01; ****, p < 0.0001. (c) Glycan node analysis peak areas normalized to heavy glucose, and (d) to endogenous hexoses. Red squares highlight significant changes in 4-linked glucose (4-Glc). Data are presented as the mean ± standard deviation (SD) of six replicates. For each glycan node, differences between EV subtypes were searched for with a Student’s t-test, using the two-stage linear step-up procedure of Benjamini, Krieger, and Yekutieli, with Q = 0.1% to correct for false discoveries. **, p < 0.01; ***, p < 0.001; ****, p < 0.0001.

