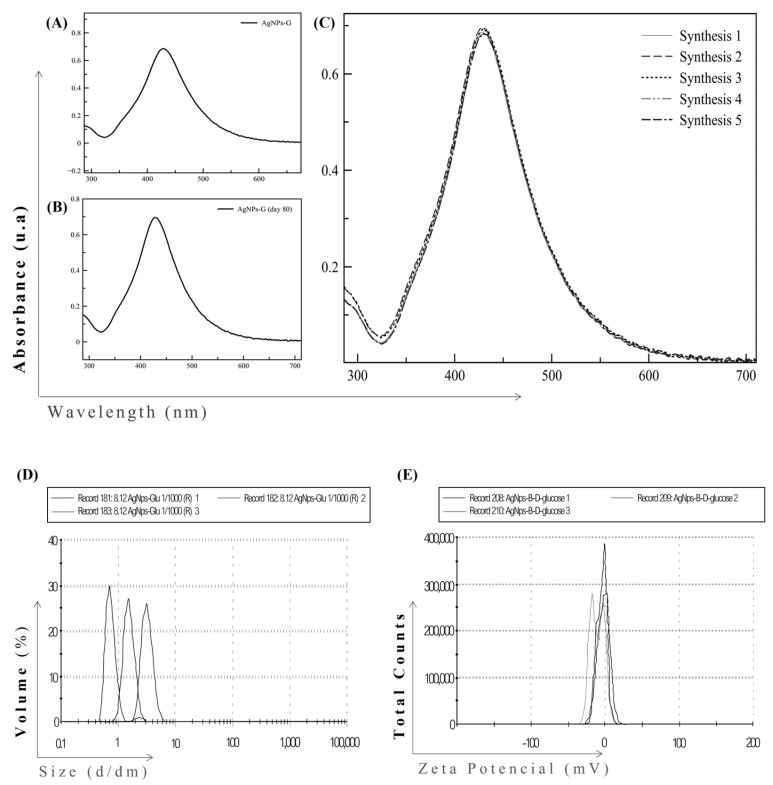
Figure 1.
UV-Vis and DLS spectra of AgNPs-G. (A) UV-visible absorption spectrum of AgNPs-G at day 0, (B) day 80, and (C) synthesized five times independently. All spectra are reported as absorbance in arbitrary units (au, Y-axis) versus wavelength (nm, X-axis). (D) Size distribution of AgNPs-G and (E) zeta potential by DLS and PALS, respectively.

