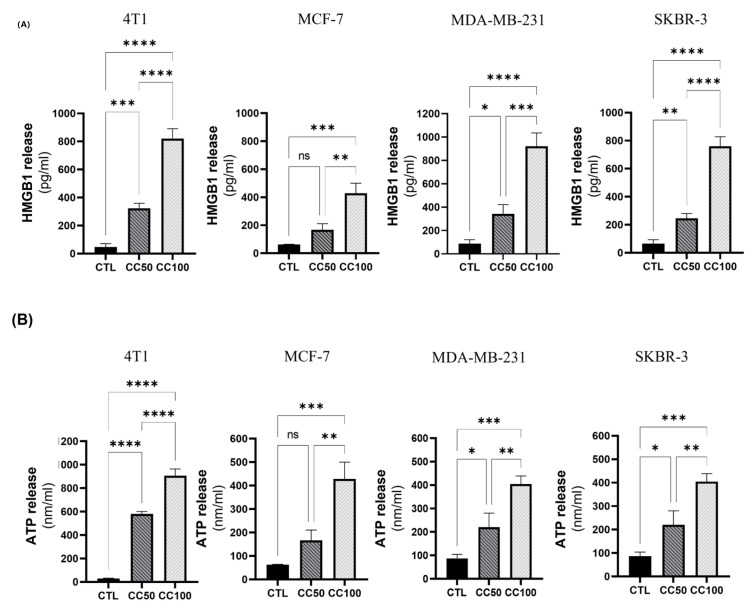
Figure 4.
Treatment with AgNPs-G induces the release of HMGB1 and ATP. (A) Cells were treated at the corresponding CC50 and CC100 concentrations for each cell line. Subsequently, 100 μL of the supernatants were taken for HMGB1 measurements using an ELISA kit, according to the manufacturer’s instructions. (B) Cells were treated at the corresponding CC50 and CC100 concentrations for each cell line. Subsequently, 100 μL of the supernatants were taken to perform ATP measurements using a bioluminescence kit, according to the manufacturer’s instructions. Quantitative data (mean ± standard deviation) were reported. Statistical analyzes were performed by ANOVA using Tukey’s test p < 0.033(*), p < 0.002 (**), p < 0.0002(***), p ˂ 0.0001 (****) and ns (not significant p < 0.12).

