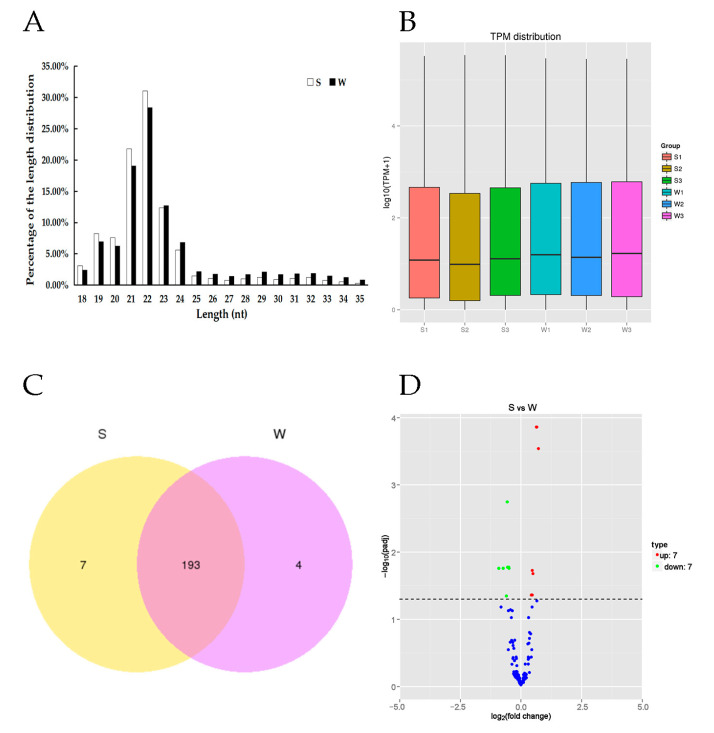
Figure 1.
Distribution of length, transcript per million (TPM) distribution, Venn diagram and Volcano plot of miRNAs. (A) Distribution of the lengths of the miRNAs reads in the honey bee with strong or weak olfactory performance. The lengths of the miRNAs mainly ranged from 18 nt to 35 nt and peaked at 22 nt. (B) The y-axis represents log10TPM+1from three groups S, strong and W, weak performing learning and memory. (C) Venn diagram represent the total of 204 miRNAs identified in the two groups (S and W) of honey bees, of which seven unique in S and four unique in W and 193 common DEmiRNAs. (D) Differentially expressed miRNAs in the brain between strong olfactory performance and weak olfactory performance based on the fold change (FC) and the significance levels after correction.

