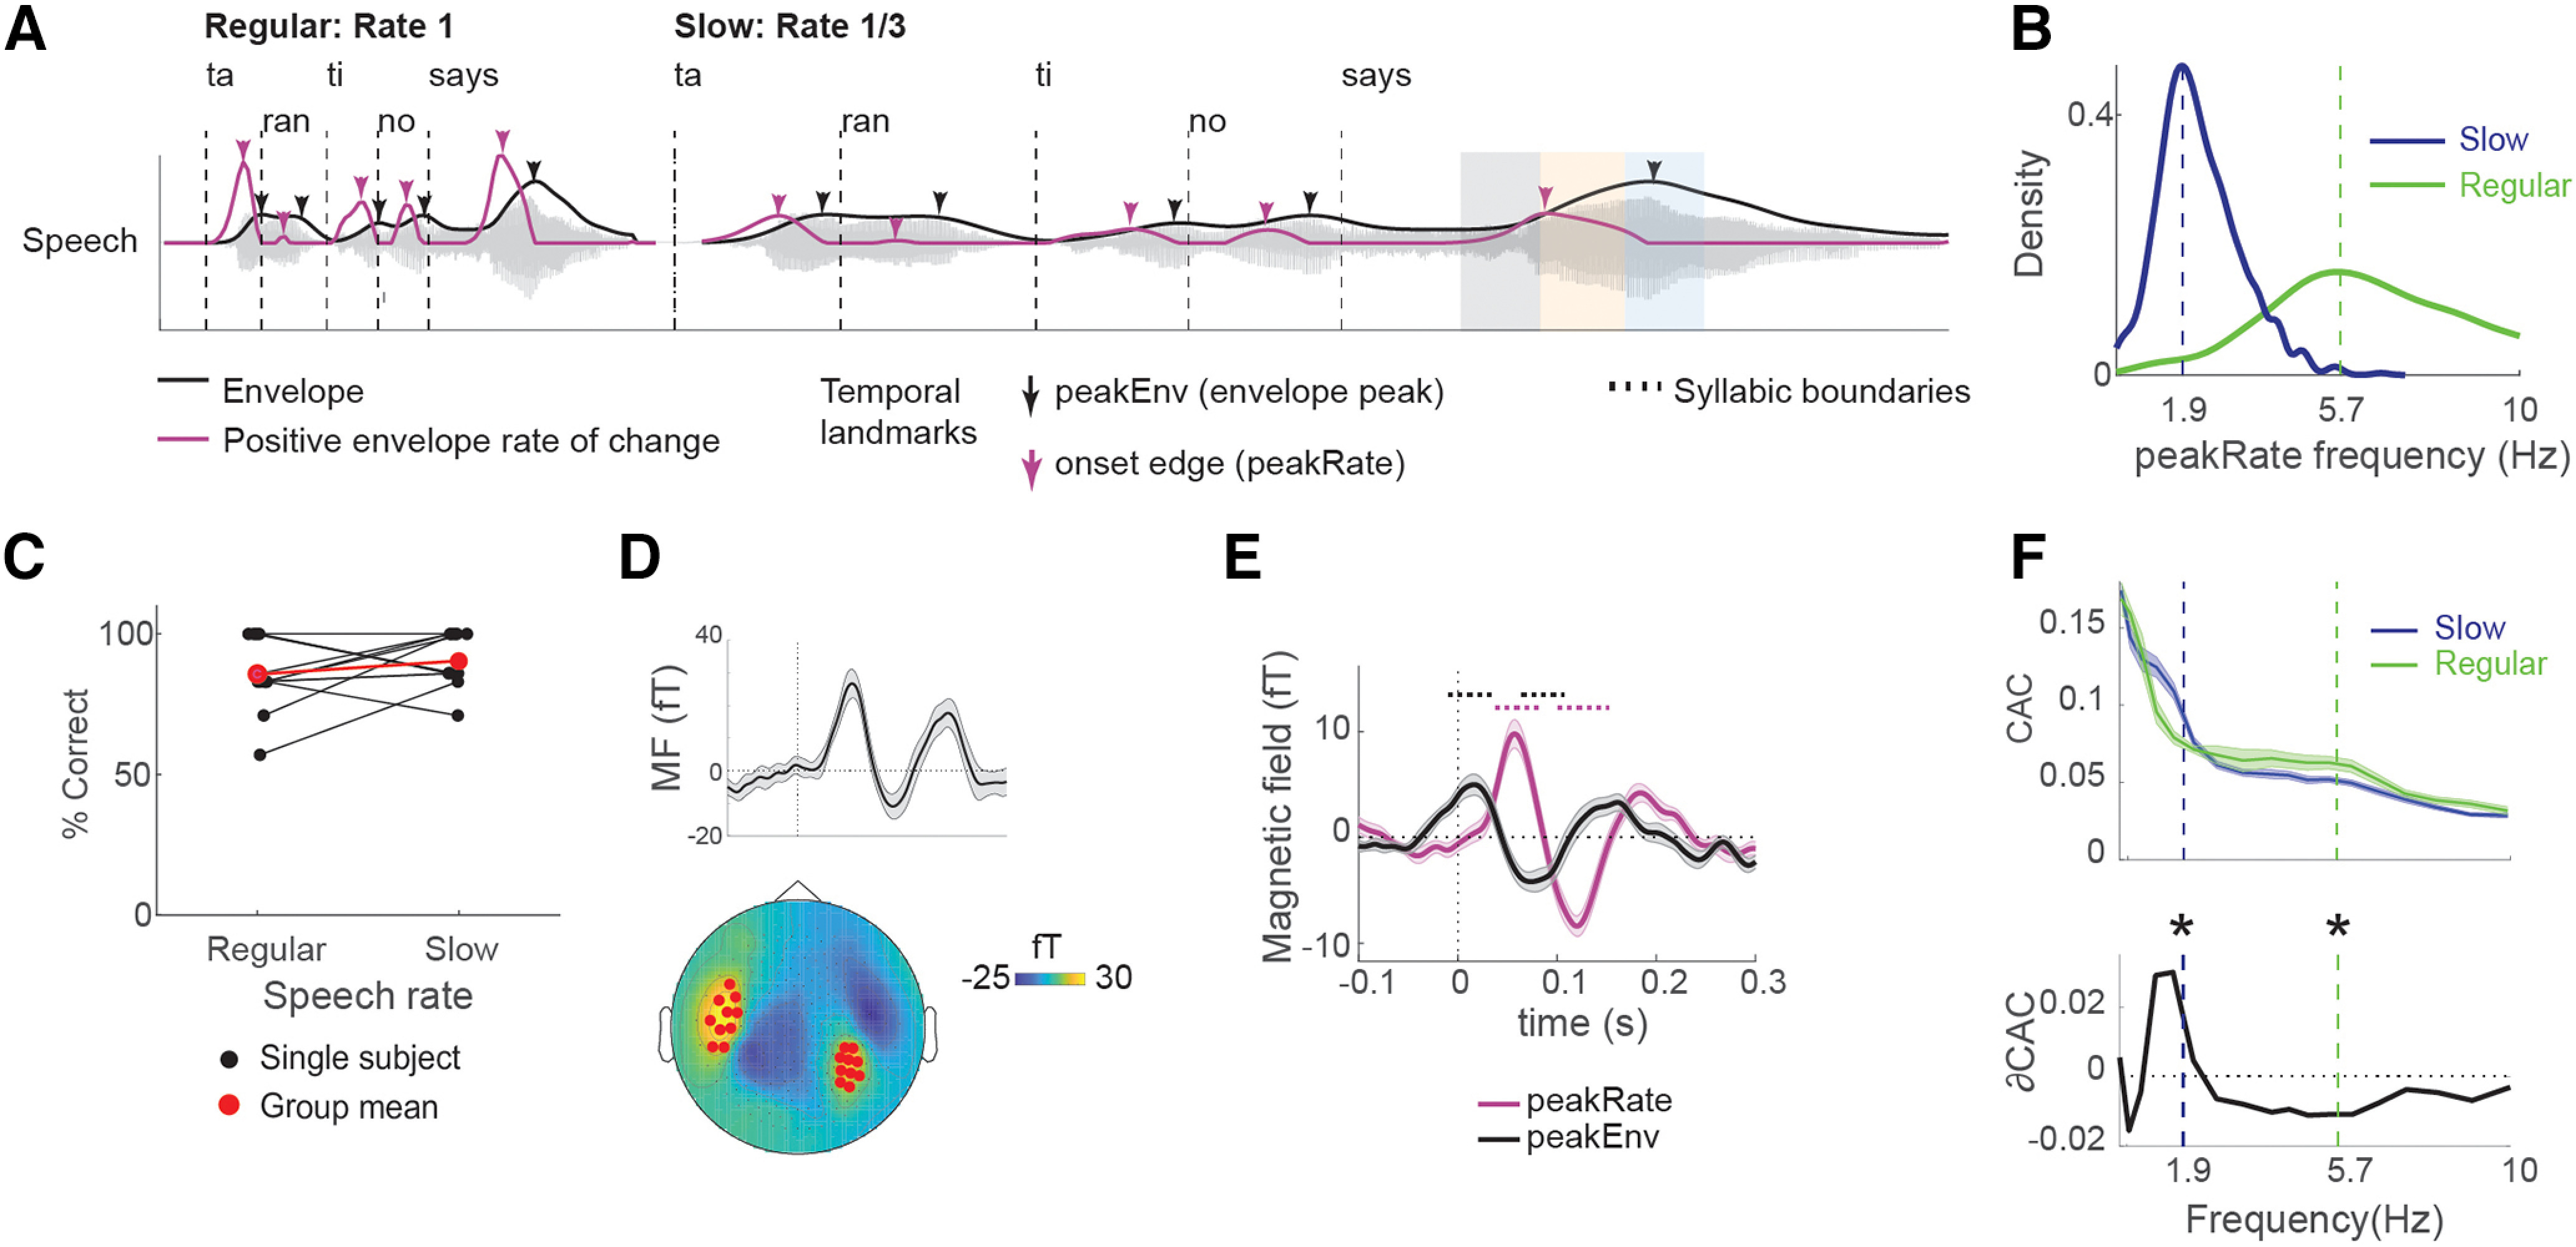
Figure 1.

Task design and envelope tracking in neural data. A, The acoustic waveform of an example utterance (“Tarantino says…”), with syllable boundaries, amplitude envelope, and first temporal derivative of the envelope superimposed on it. The same utterance is shown at a regular rate (left) and slowed (right) speech rate. Arrows indicate candidate temporal landmark that might induce phase-locking. Black represents local peaks in the envelope, peakEnv. Purple represents acoustic edges, defined as local peaks in the first temporal derivative (rate of change) of the envelope, peakRate. For transcripts of the entire speech stimulus, see Extended Data Table 1-1. For example stimulus excerpts at two different speech rates, see Extended Data 1 and Extended Data 2. B, Frequency of occurrence for peakRate/peakEnv events. Dashed vertical lines indicate the average frequency of peakRate events in slow (blue, 1.9 Hz) and regular speech (green, 5.7 Hz). C, Single-subject (black) and group-average (red) comprehension performance. For a list of all comprehension questions, see Extended Data Table 1-2. D, Sensor selection was based on M100 response to utterance onsets. Top, Group-averaged evoked response across all 20 sensors included in the analysis. Error bars indicate ±1 SEM across subjects. Bottom, Topographic map of a group-averaged M100 response with selected sensors marked in red. E, Group-averaged evoked response aligned to peakRate and peakEnv events. Dotted lines indicate clusters with p < 0.05 with a cluster-based permutation test against 0. Error bars indicate ±1 SEM across subjects. F, CAC between MEG responses and speech envelope (top), and the difference between slow and regular speech (ΔCAC, bottom). Data were filtered in semi-logarithmically spaced bands between 0.3 and 10 Hz for this analysis. Dashed vertical lines indicate the average frequency of peakRate events in each condition, as shown in D. *p < 0.01, post hoc t tests with interaction p < 0.01. Error bars indicate ±1 SEM across subjects.
