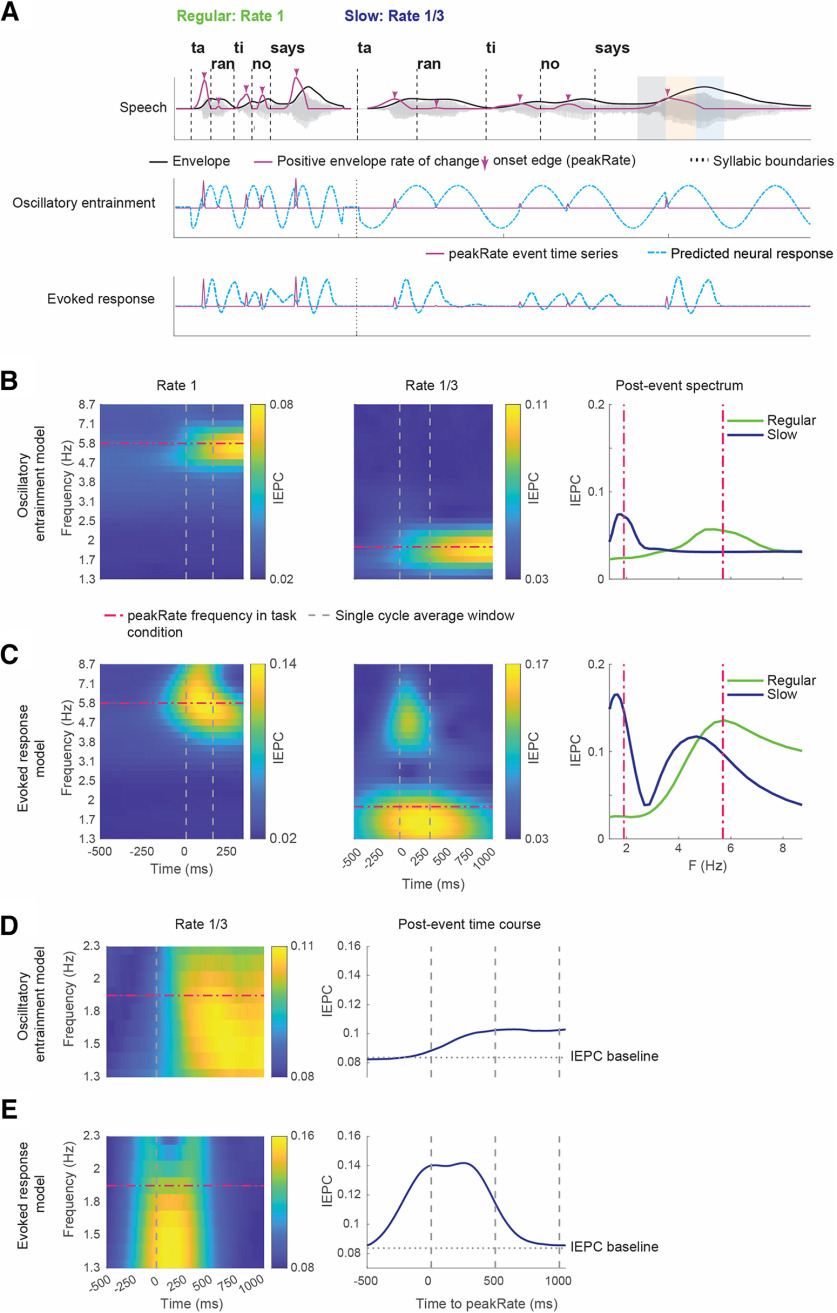
Figure 2.
Spectral and temporal signatures of IEPC in oscillatory entrainment and evoked response models. A, Schematic illustrations of the predicted neural response to the utterance in Figure 1A using three different models. Top, Speech signal. Middle, Oscillatory entrainment model. Bottom, Evoked response model. B, IEPC patterns predicted by oscillatory entrainment model for regular and slow speech with a focus on spectral precision. Dashed lines indicate the frequency of peakRate events in each condition. C, Same as in B, but for evoked response model. D, Temporal dynamics of IEPC in the delta frequency range predicted by oscillatory entrainment model, based on peakRate events that are at least 1000 ms apart from following events (n = 113 events) in the Slow speech condition. E, Same as in D, but for the evoked response model.

