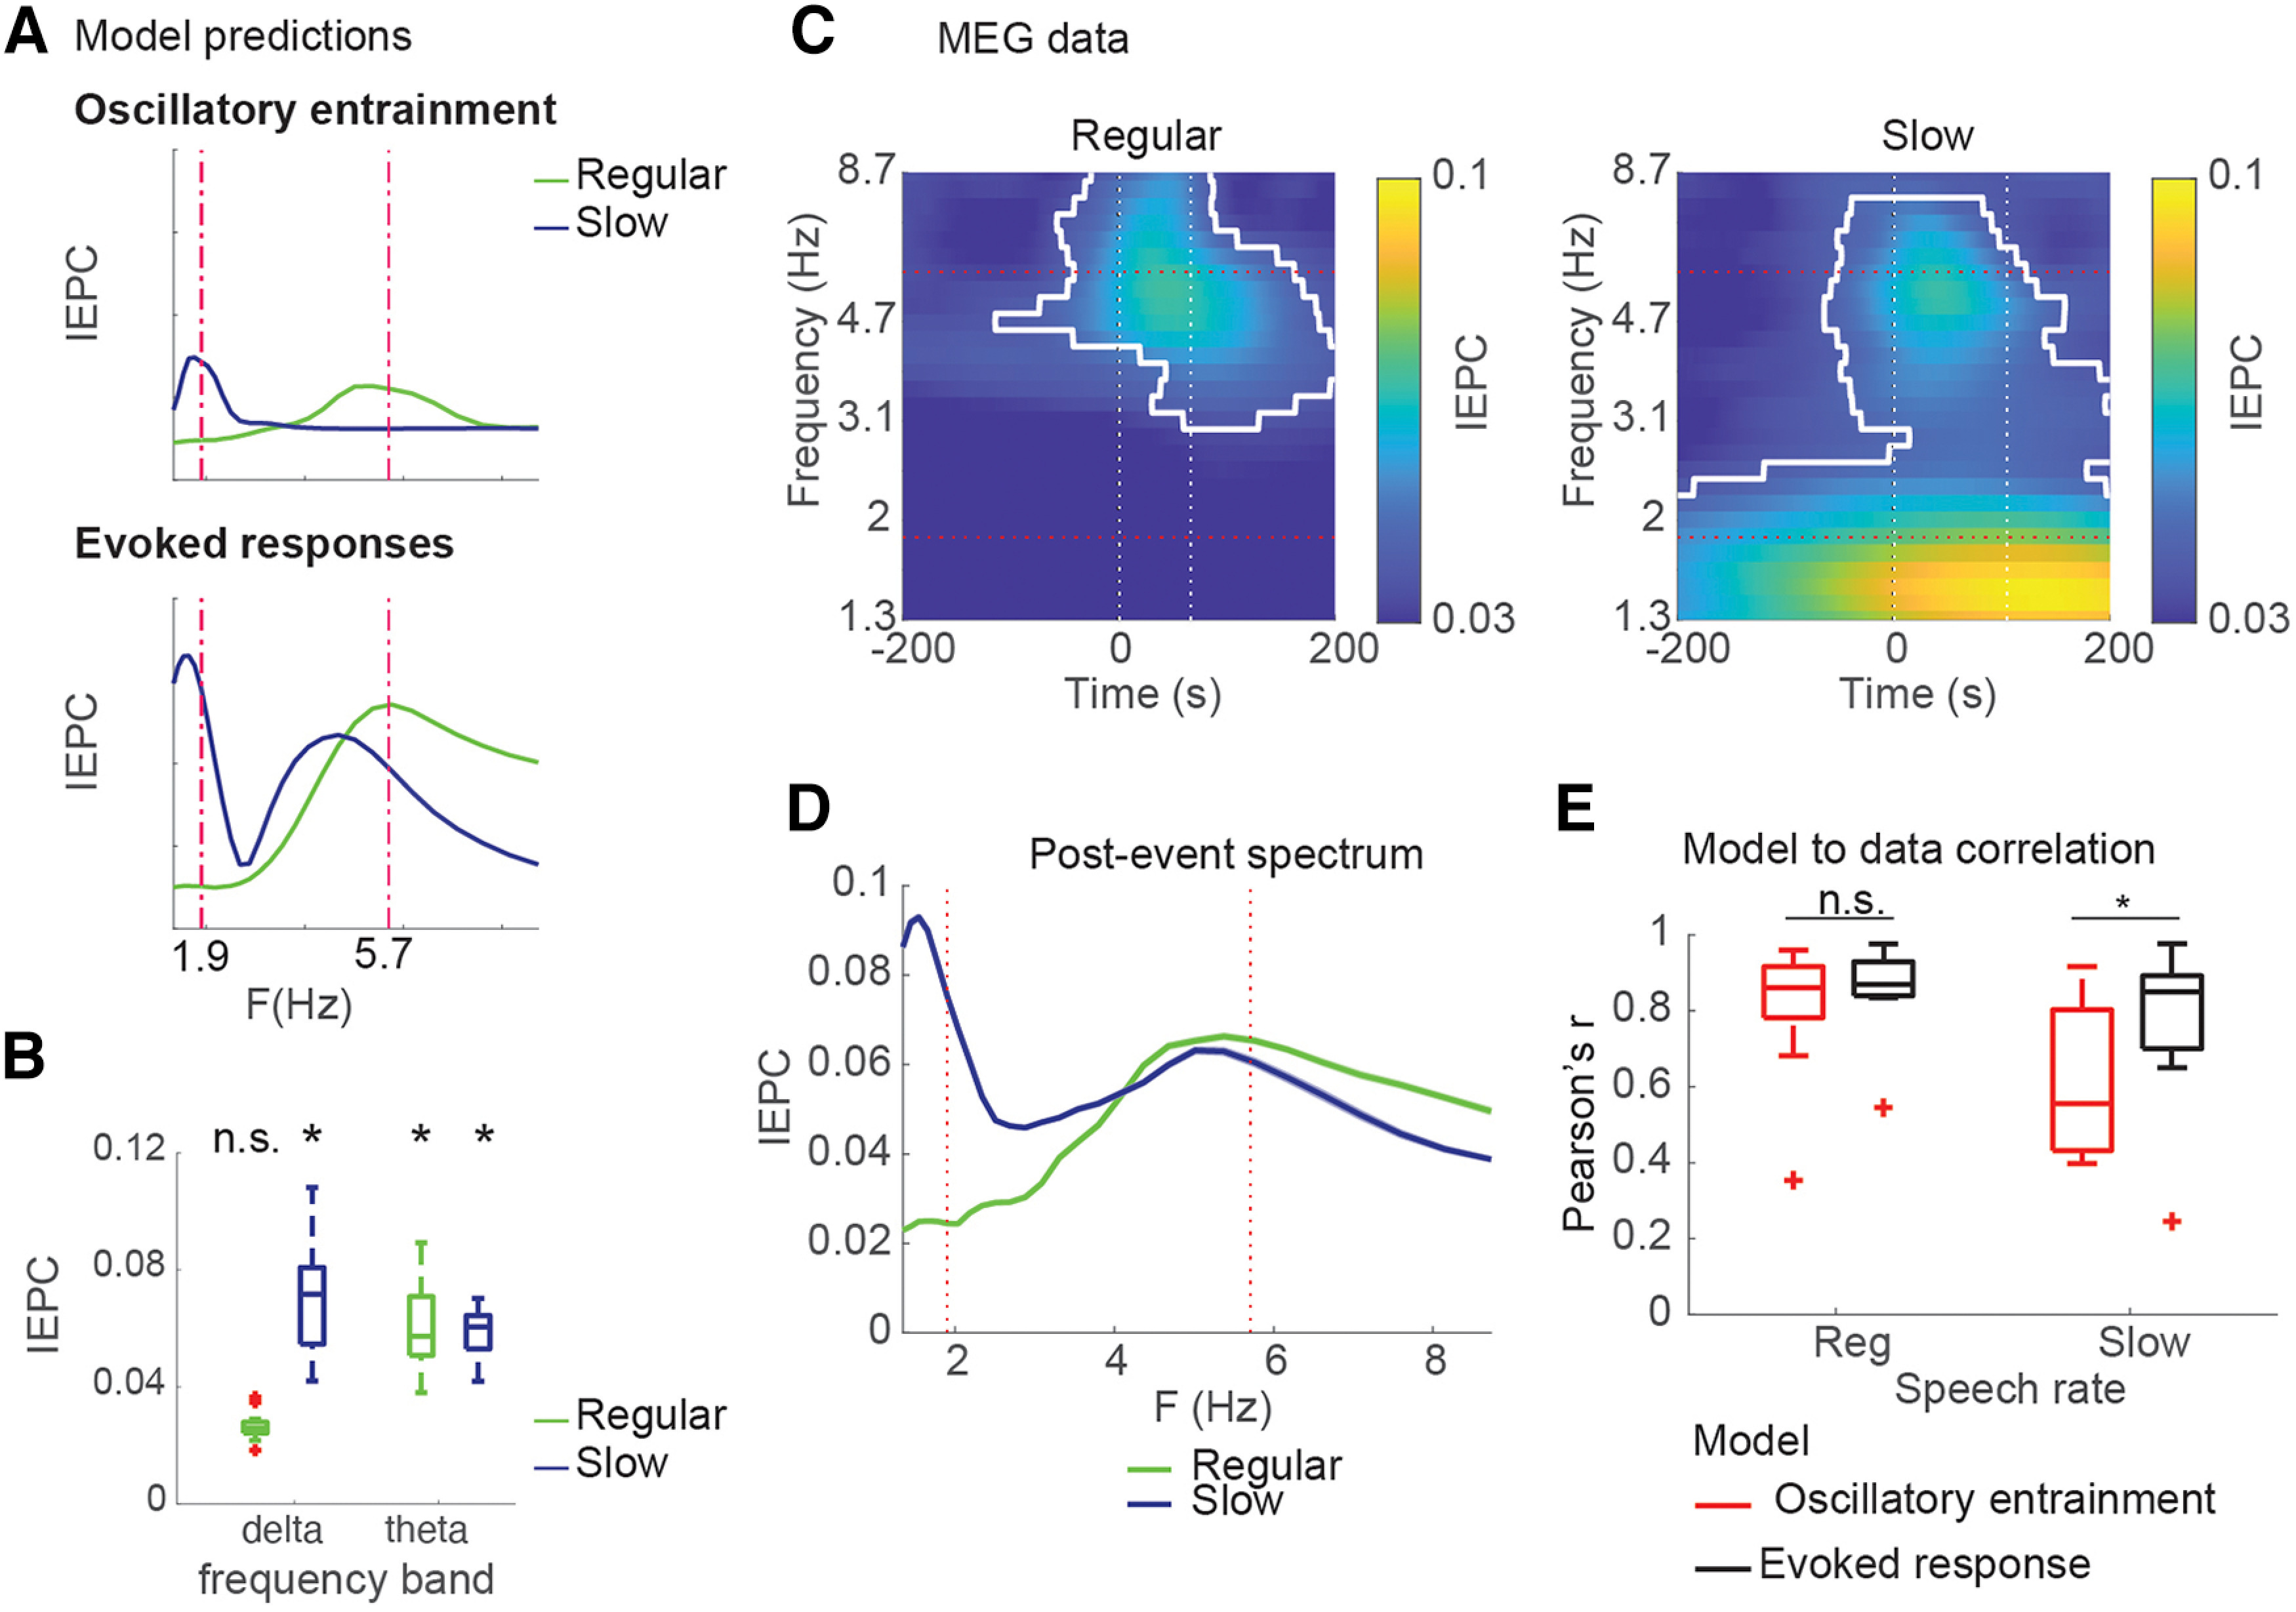
Figure 3.

Spectral patterns of IEPC in MEG data. A, Predictions of oscillatory and evoked response models for spectral distribution of phase-locking to peakRate events. B, Average IEPC magnitudes observed in regular and slowed speech conditions within TF ROIs in theta and delta bands one oscillatory cycle after peakRate event. C, IEPC patterns observed in MEG responses to speech at regular (left) and slowed (middle) rates. D, Spectral IEPC profile averaged across time corresponds to predictions of the evoked response models (A, bottom). Significance contours in C, D, based on 2D cluster-based permutation testing against pre-event baseline (p < 0.001). E, Correlation between IEPC time courses predicted by the models and observed in the neural data. *p < 0.05.
