Figure 5.
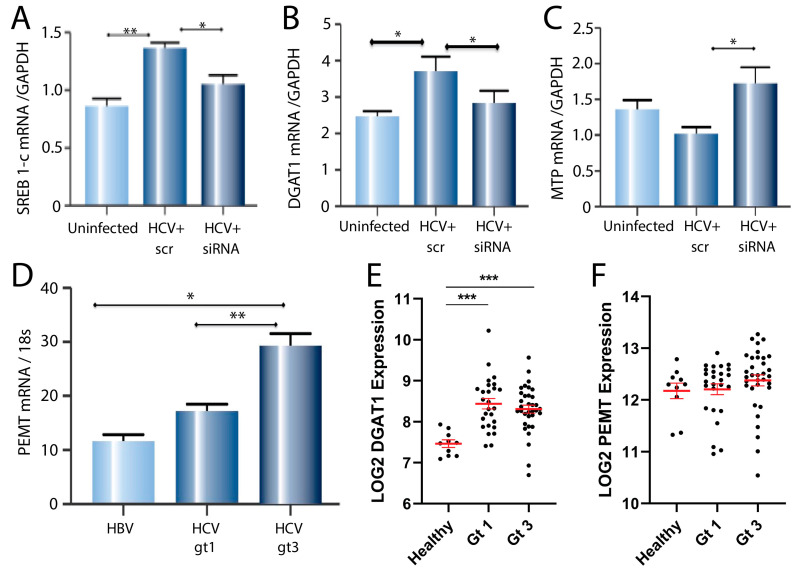
Expression of genes associated with lipid metabolism in response to HCV infection and PEMT knock-down. Real-time PCR quantification of (A) SREB 1-c, (B) MTP and (C) DGAT1 mRNA (normalised to GAPDH) in uninfected and HCV-infected cells treated with 20 nM siRNA targeting PEMT or scrambled siRNA control (* p < 0.05, ** p < 0.01). (D) Relative expression of PEMT mRNA (normalised to 18s) in liver biopsies from patients with HBV (n = 23), HCV-genotype 1 (n = 31) or genotype 3 (n = 24) infection (* p < 0.05, ** p < 0.01). (E) Relative expression of DGAT1 mRNA in liver biopsies from patients with healthy liver (n = 10), HCV-genotype 1 (n = 26) or genotype 3 (n = 33) infection (*** p < 0.001). Black circles represent individual data points. (F) Relative expression of PEMT mRNA in liver biopsies from patients with healthy liver (n = 10), HCV-genotype 1 (n = 26) or genotype 3 (n = 33) infection. Black circles represent individual data points.

