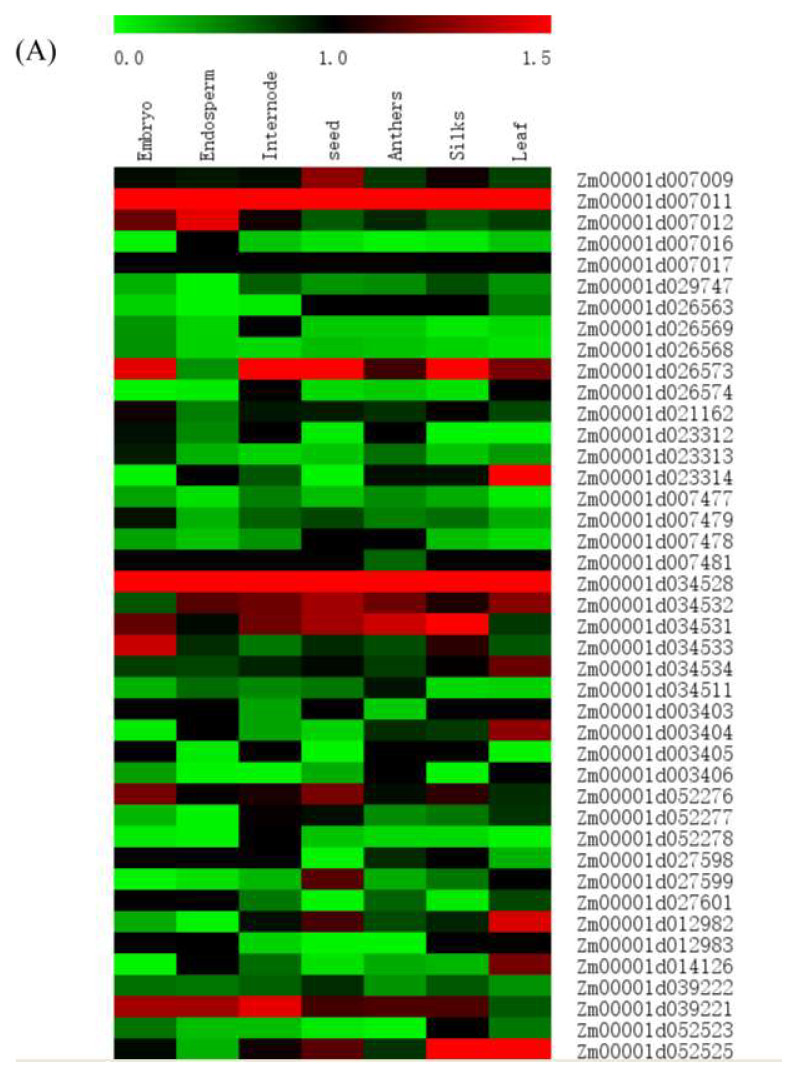
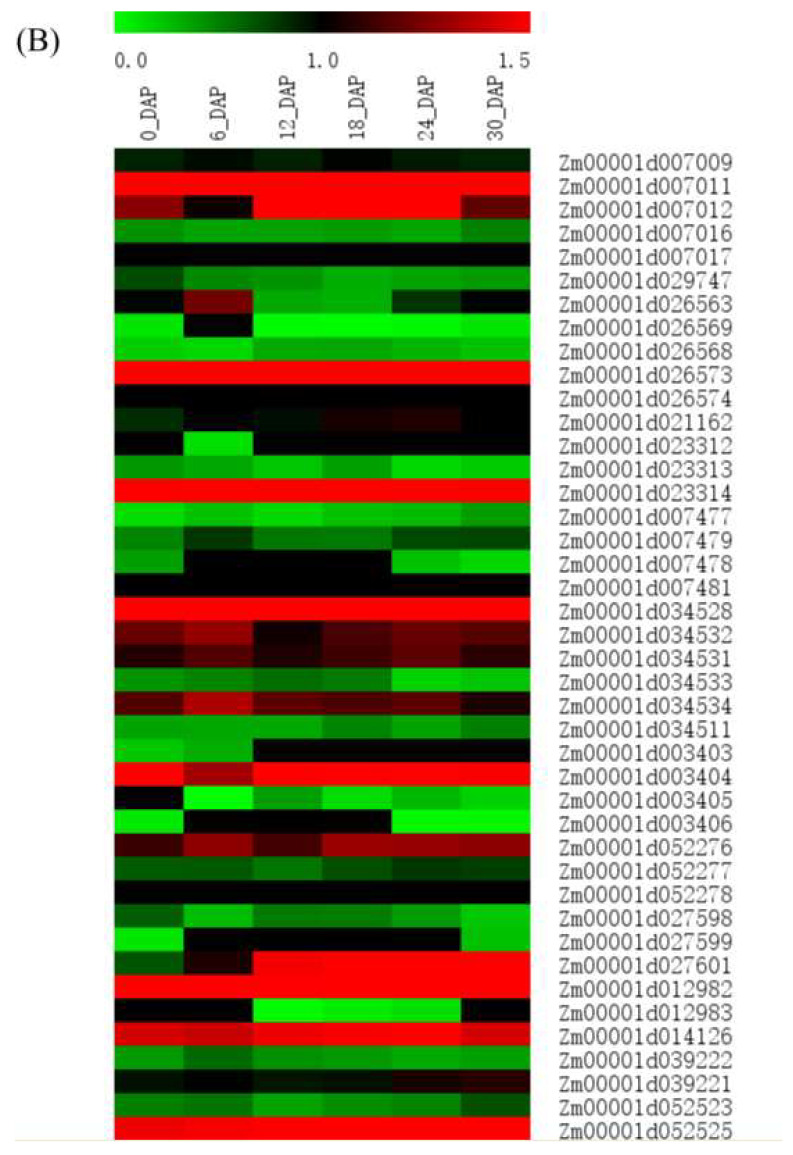
Figure 7.
Heat map of the expression patterns of candidate genes determined by genome-wide association study. The value used in the figure is the log10 conversion ratio of the counts of standardized PRKM counts of chlorophyll content in (A) seven tissues and (B) in leaves on days 0, 6, 12, 18, 24 and 30 of maize silking stage. Columns and rows are sorted according to similarity. Compared with different periods of a specific gene, red, black and green represent higher, moderate and lower expression, respectively.


