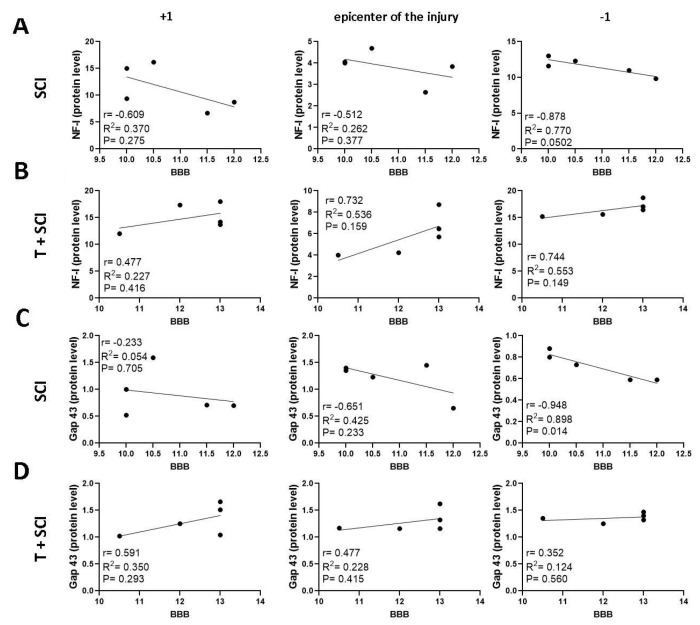
Figure 11.
Linear regression analysis of correlation between protein levels for NF-l (A,B), Gap-43 (C,D), and BBB neurological score (A–D) at the lesion site, cranial, and caudal segments in Th9 compression groups (SCI and T + SCI). Scatterplots of individual values with regression line correlation coefficient (r) and coefficients of determination (R2) calculated using regression analysis and p-Value (n = 5).

