Figure 7.
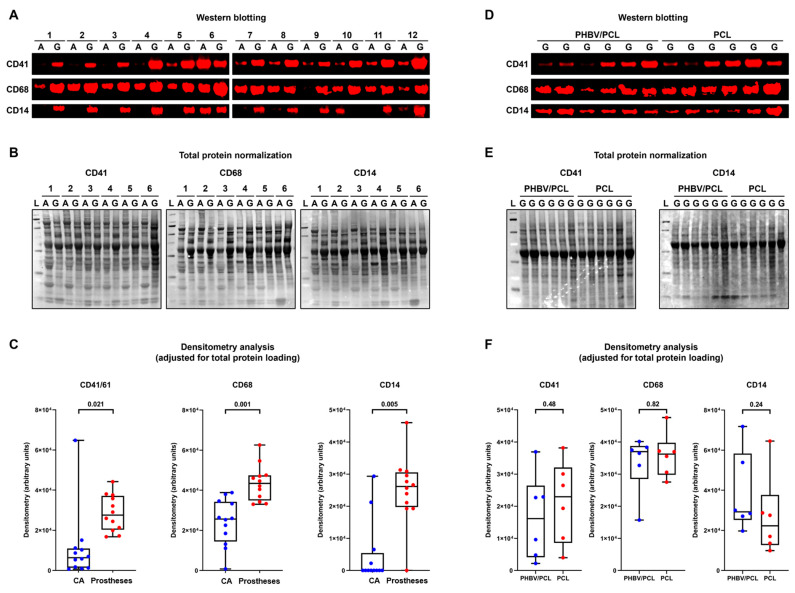
Western blotting of platelet and immune cell markers within the prostheses six months postimplantation as compared to the contralateral ovine carotid arteries. (A) Fluorescent Western blotting of intact carotid arteries (A) and prostheses (G) probed for CD41 (top), CD68 (middle), and CD14 (bottom). N = 12 samples per group. (B) Total protein staining of the representative membranes (CD41: (left); CD68: center; CD14: (right)) using Fast Green FCF. (C) A semi-quantitative densitometry analysis performed after the pairwise adjustment of the specific signal for total protein staining. The total protein measurement from each prosthesis sample was adjusted for such measurements from the corresponding carotid artery with the following correction of the specific signal quantified in prostheses by Western blotting. Each dot on the plots (blue for carotid arteries and red for prostheses) represents a measurement from one sample (n = 12 measurements per group). Whiskers indicate the range, box bounds indicate the 25–75th percentiles, and center lines indicate the median; p values are provided above boxes, from the Wilcoxon matched-pairs signed-rank test. (D) Fluorescent Western blotting of PHBV/PCL/PVP/Ilo/A and PCL/PVP/Ilo/A prostheses probed for CD41 (top), CD68 (middle), and CD14 (bottom). N = 6 prostheses per group. (E) Total protein staining of the corresponding membranes (CD41: (left); CD14: (right)) using Fast Green FCF. (F) A semi-quantitative densitometry analysis performed after the adjustment of the specific signal for total protein staining. Each dot on the plots (blue for PHBV/PCL/PVP/Ilo/A and red for PCL/PVP/Ilo/A prostheses) represents a measurement from one sample (n = 6 measurements per group). Whiskers indicate the range, box bounds indicate the 25–75th percentiles, and center lines indicate the median; p values are provided above boxes, from the Mann–Whitney U-test.

