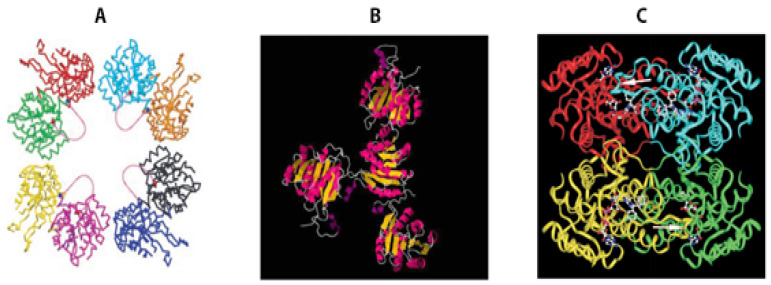
Figure 3.
Comparison of the crystal structure images of human Aβ-bound ABAD (A,B) to that of human 17β-HSD10 (C). (A) A section of the crystal packing interactions, showing the large solvent channels. Each ABAD molecule is shown in a different color. The ordered ends of the LD loop, residues 94 and 114, are marked as red and blue balls, respectively, and the hypothetical loops are shown in pink as dotted lines [33]; (B) PDB: 1SO8 [33] shows only one subunit associated with another three subunits which have no contact with each other; (C) PDB: 1U7T [67] shows a close association of four subunits in human HSD10.

