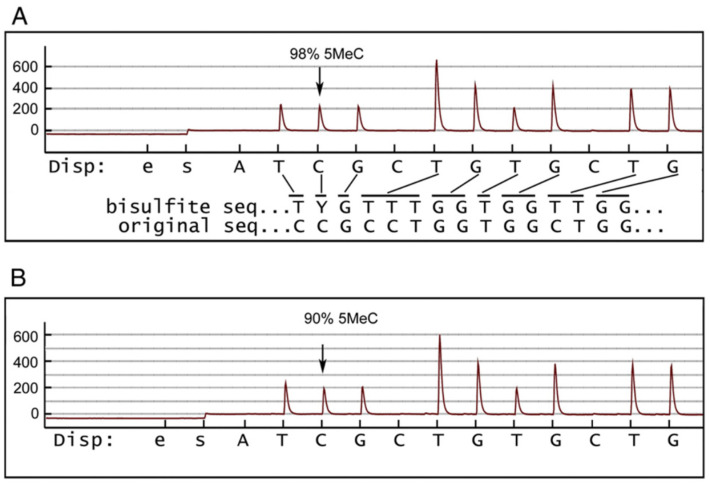
Figure 7.
Methylation analysis of exon 4 of the HSD17B10 gene. The bisulfite sequencing of chromosomal DNA from a normal male is displayed in (A), and that from a normal female in (B). The ordinate shows the relative light unit detected after dispensation of each nucleotide substrate. The abscissa shows the dispensation order (“e” and “s” are the controls). The “bisulfite” line shows the predicted sequence after modification. “Y” represents C or T. Lines connecting the dispensed nucleotide to the bisulfite sequence indicate how the light signal represents the modified sequence. The height of the signal is proportional to the number of nucleotides at that position [82] (reproduced from Figure 1 of Ref. [82]).

