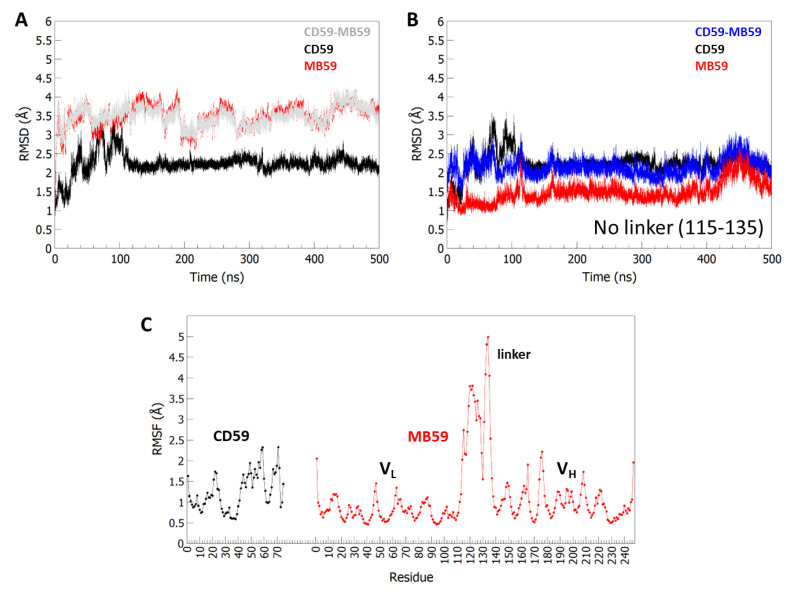
Figure 3.
RMSD and RMSF analysis from MD simulations. (A) Time evolution of RMSD (Å), computed on Cα atoms, for the MD59-CD59 and isolated chains. In (B) RMSD evolution upon removal of the linker 115–135. The colour code is indicated. (C) RMSF values, calculated on backbone Cα atoms in the equilibrated region (100–500 ns).

