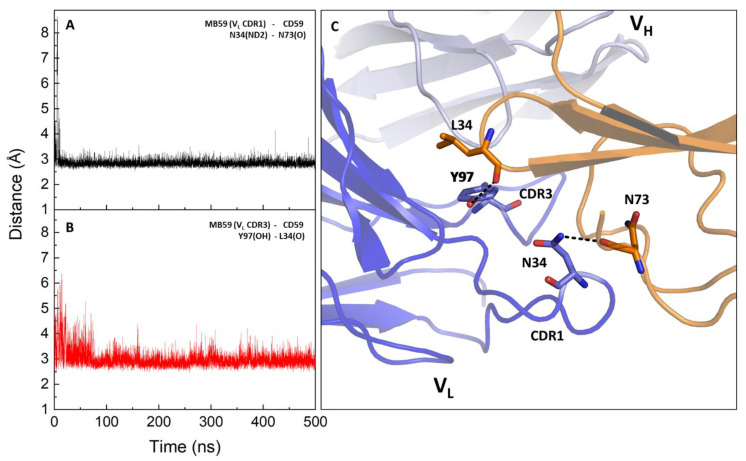
Figure 4.
Hydrogen bonding distance evolution of representative key interactions in the MD trajectory of the MB59-CD59 complex. (A,B) Time evolution of H-bonding interactions involving MB59 CDR1 (A) and CDR3 (B). (C) Cartoon representation showing the H-bonding interactions on a representative structure of the trajectory (the closest to the average structure).

