Figure 3.
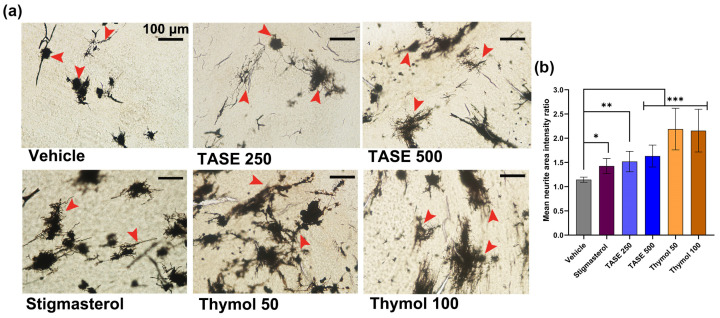
Golgi–Cox staining exhibiting neurite outgrowth effect of TASE and thymol in pre-natal supplementation at P1 pups brain. (a) Representative images demonstrating neuronal differentiation and outgrowth effect. Red arrow indicates significant neuron. Here, pre-natal supplementation and groups are same as in Figure 1. Scale bar, 100 μm, is applied to all images. (b) Mean neurite area intensity ratio between different treatment groups. Ratio between neurite intensity and background intensity with equal area was averaged, and one-way ANOVA with Dunnett’s multiple comparisons post hoc test was used for comparison between groups. (n = 3 pups from different mothers of same treatment group). * p < 0.05, ** p < 0.01, and *** p < 0.001 represent difference between vehicle control and treatment groups.

