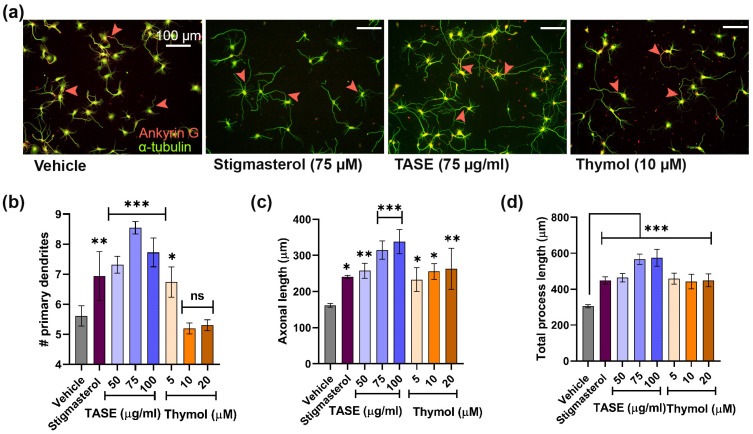
Figure 4.
Determination of optimal concentration of TASE and thymol for neurite outgrowth activity. (a) Immunofluorescence images for cultures incubated with vehicle (DMSO), positive control (stigmasterol), ethanolic extracts of TASE, and thymol compound with optimal concentration. Whole neuron morphology was stained with alpha-tubulin (green) and axon initial segment marker, known as ankyrin G (red). Arrowhead represents the axon hillock stained with ankyrin G. (b) Number of primary processes. (c) Length of longest process. (d) Total length of primary processes exhibits neurite outgrowth promoting activity of TASE and thymol. A scale bar, 100 μm, is applied to all the images. Statistical significance is compared to vehicle with p values: * p < 0.05, ** p < 0.01, *** p < 0.001, and ns: not significant (one–way ANOVA with Dunnett’s multiple comparisons test). Data points are represented as mean ± SD (n ≥ 30 individual neurons from three independent experiments). SD, standard deviation.

