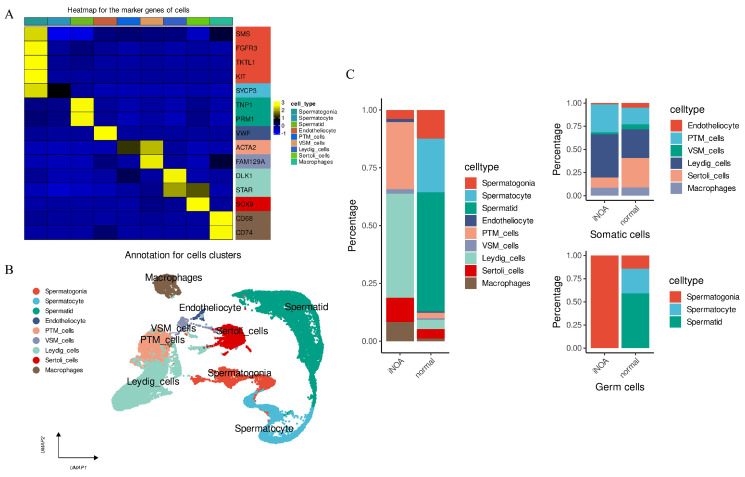
Figure 3.
ScRNA-seq data were performed for annotation and to analyze the cell proportion distribution between iNOA and normal. (A) Heatmap to display the expression levels of marker genes in our identified cells. (B) UMAP plot shows the distribution of the nine cell types. (C) Cell fraction distribution differences between iNOA and normal. The figure presents three panels, with the left panel showing the overall cell fraction in the two groups being compared. The upper right panel represents the distribution of somatic cell fractions, while the lower right panel shows the distribution of germ cell fractions in the same groups.

