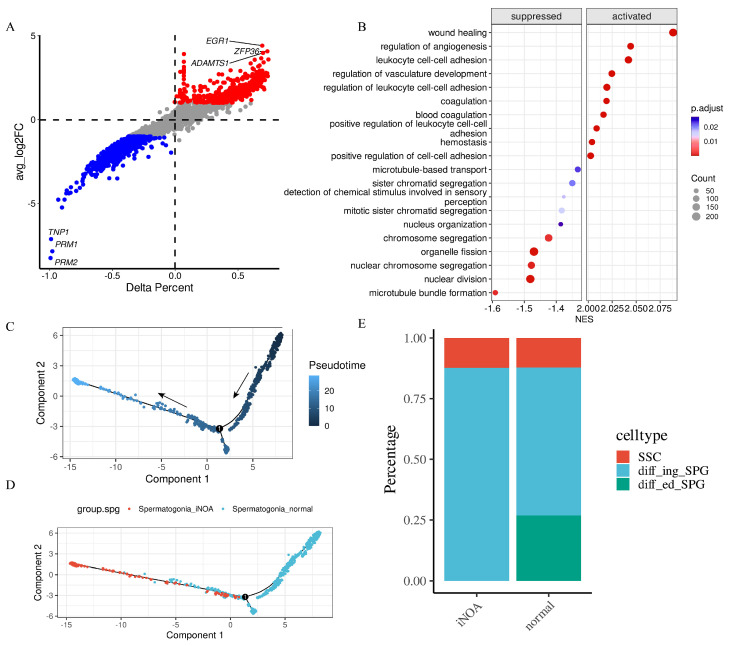
Figure 4.
Significant difference was found between iNOA and normal. (A) Differential gene expression between iNOA and normal. (B) GSEA reveals that stress response pathways are activated and reproductive processes are suppressed in iNOA. (C) Trajectory analysis for spermatogonia displays the starting point in pseudotime with arrows. (D) Trajectory analysis reveals significant differences in spermatogonia between iNOA and normal. (E) Cell fraction analysis shows the differences of the three spermatogonia subtypes, including spermatogonia stem cells (SSC), differentiating spermatogonia (diff_ing_SPG), and differentiated spermatogonia (diff_ed_SPG).

