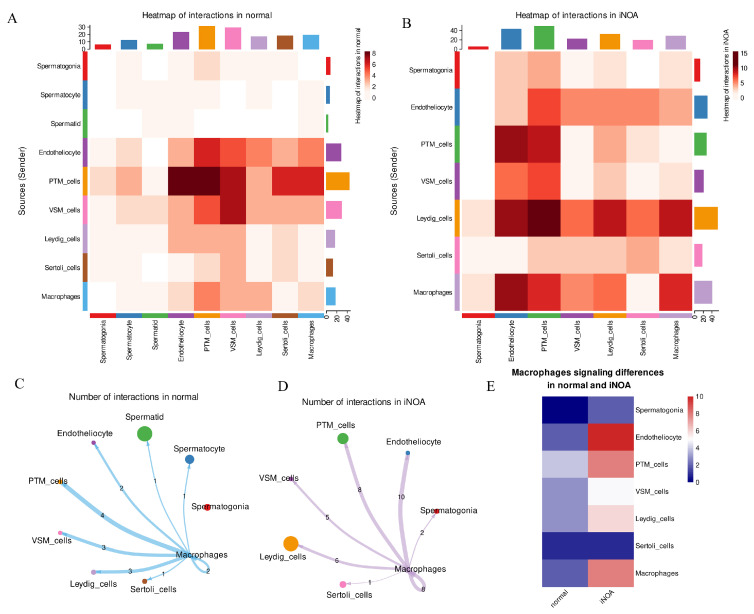
Figure 5.
The analysis of cell–cell interactions showed an increase in macrophage signaling in iNOA. (A,B) Heatmap displays an overview of cell–cell interactions in both normal and iNOA groups. (C,D) Analysis of macrophages interacting with other cells in both iNOA and normal groups. (E) Heatmap demonstrates the differences in macrophage interactions between iNOA and normal groups.

