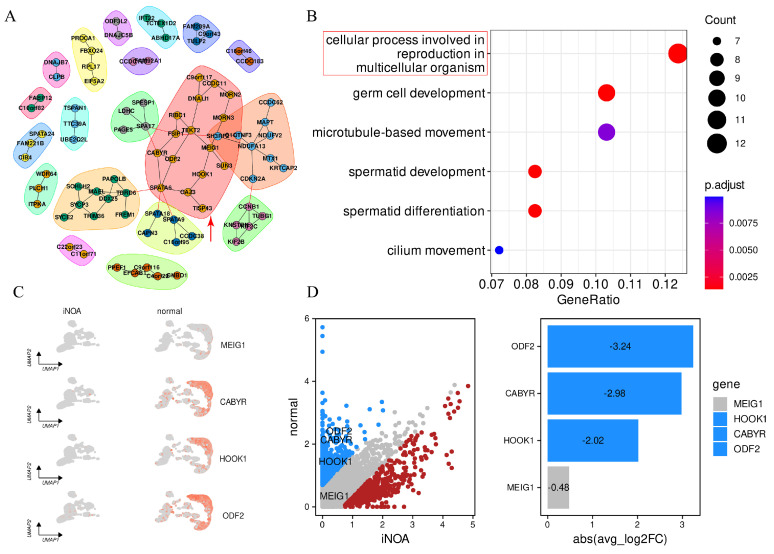
Figure 8.
Screening for potential biomarkers of iNOA. (A) PPI network for the top 200 genes in the blue module. (B) GO enrichment analysis for the 200 genes to uncover their functional characteristics in reproduction. (C) UMAP plot to depict the expression patterns of the four intersecting hub genes (MEIG1, CABYR, HOOK, ODF2) in the iNOA and normal groups. (D) Expression differences of key genes in iNOA and normal (blue for downregulated and red for upregulated genes in iNOA).

