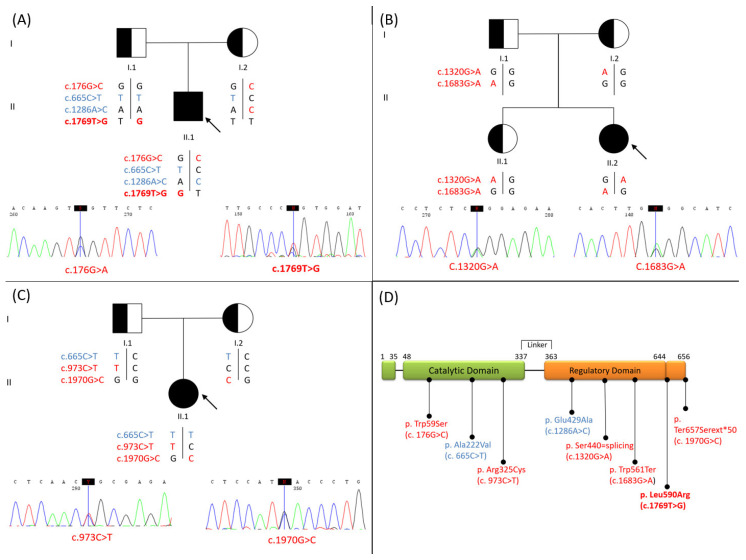
Figure 3.
MTHFR patients’ pedigree. (A) Patient 1. (B) Patient 3. (C) Patient 5. (D) The figure is a schematic representation of MTHFR protein domains (catalytic and regulatory), showing the localization of mutations identified in patients. Mutations are in red (the novel one in bold). The two common polymorphisms (p.Ala222Val and p.Glu429Ala) are shown in blue.  Carrier male;
  Carrier female;
  Affected male;
  Affected female;
  Proband.

