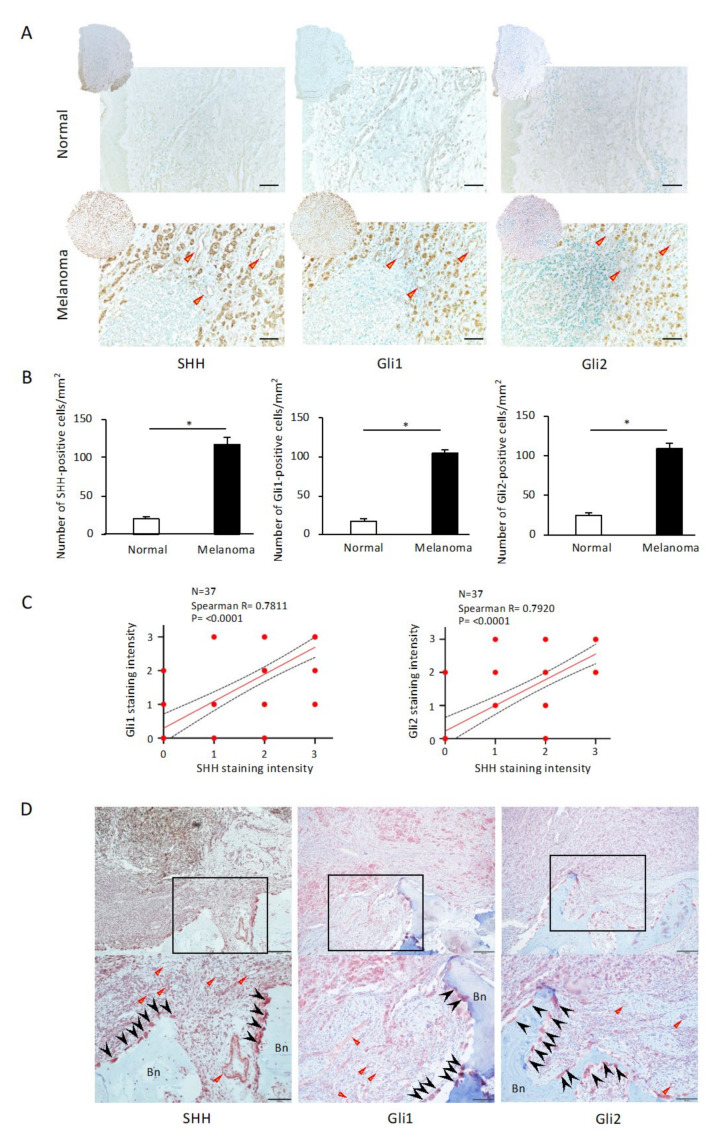
Figure 1.
Immunohistochemical analysis of the expressions of Sonic Hedgehog (SHH), Gli1, and Gli2 in human melanoma samples. (A) Representative images of SHH, Gli1, and Gli2 expressions in normal dermal tissue and melanoma. SHH, Gli1, and Gli2 are expressed not only in melanoma cells but also in tumor vascular endothelial cells in the stroma. Scale bar: 200 µm. Arrowhead: tumor vasculature. (B) The numbers of SHH-, Gli1-, and Gli2-positive cells/mm2 are significantly higher in melanoma tissues than in normal skin tissues. The data from a typical experiment (mean ± SD) are presented. * p < 0.05 between the indicated groups. (C) Staining intensity (SI, A) is evaluated visually: negative (0), weak (1), moderate (2), and strong (3). SI3 (SHH and Gli1, n = 15), SI3 (SHH and Gli2, n = 12), SI2 (SHH and Gli1, n = 7), and SI2 (SHH and Gli2, n = 4). Spearman’s correlations between the intensities of SHH and Gli1 (left) or Gli2 (right) were analyzed using GraphPad Prism 6.0. (D) Immunohistochemical staining for SHH, Gli1, and Gli2 in osteolytic malignant melanoma of the maxilla. Each photo is a magnification of the rectangle-delimited area corresponding to a melanoma bone-destructive area. Scale bars: 200 µm (upper) and 100 µm (lower). Arrowhead: osteoclasts. Triangular arrowheads: tumor vasculature. Bn: bone.

