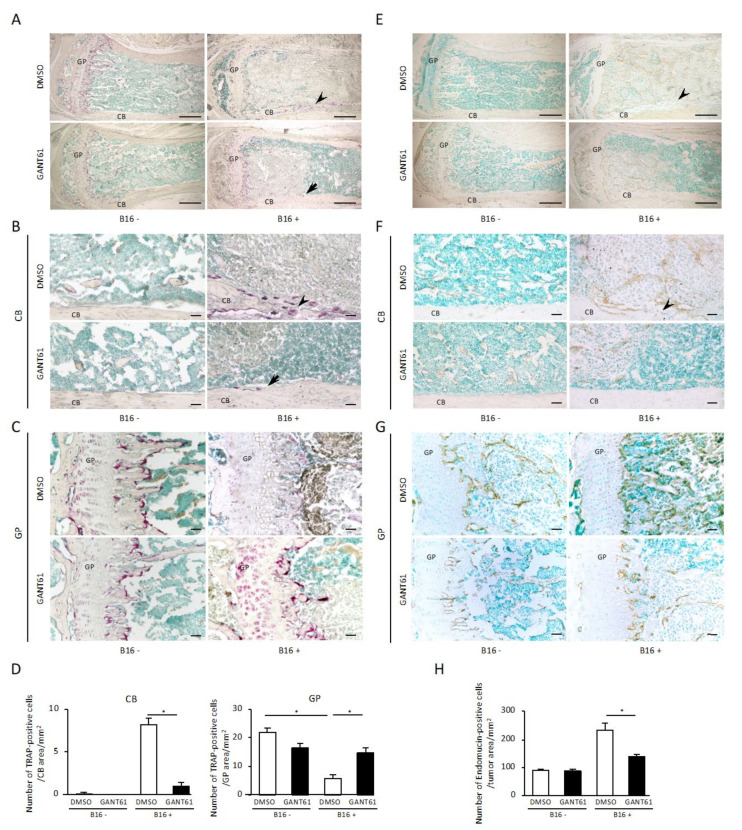
Figure 2.
Histochemical analysis for TRAP and endomucin staining of tibial metaphyses bearing B16 cells. (A–C,E–G) Representative images of TRAP (A–C) and endomucin (E–G) staining of tibial metaphyses with (right) or without (left) B16 cell inoculation and treated with DMSO (upper) or GANT61 (lower). Each image is a magnification of the typical cortical bone area (B,F) and growth plate area (C,G) of the corresponding image in panels (A,E). (D) Quantification of TRAP (+) osteoclasts along the bone–tumor interface at the cortical bone area (left) and growth plate area (right) in each experimental group (n = 5). (H) The number of endomucin positive cells/mm2 in tumor tissue area (n = 5). Arrowhead: bone rupture. Arrow: bone resorption. CB: cortical bone. GP: growth plate. Data are presented as mean ± SD. * p < 0.05 between the indicated groups. Scale bar: 500 µm (A,E). Scale bar: 50 µm (B,C,F,G).

