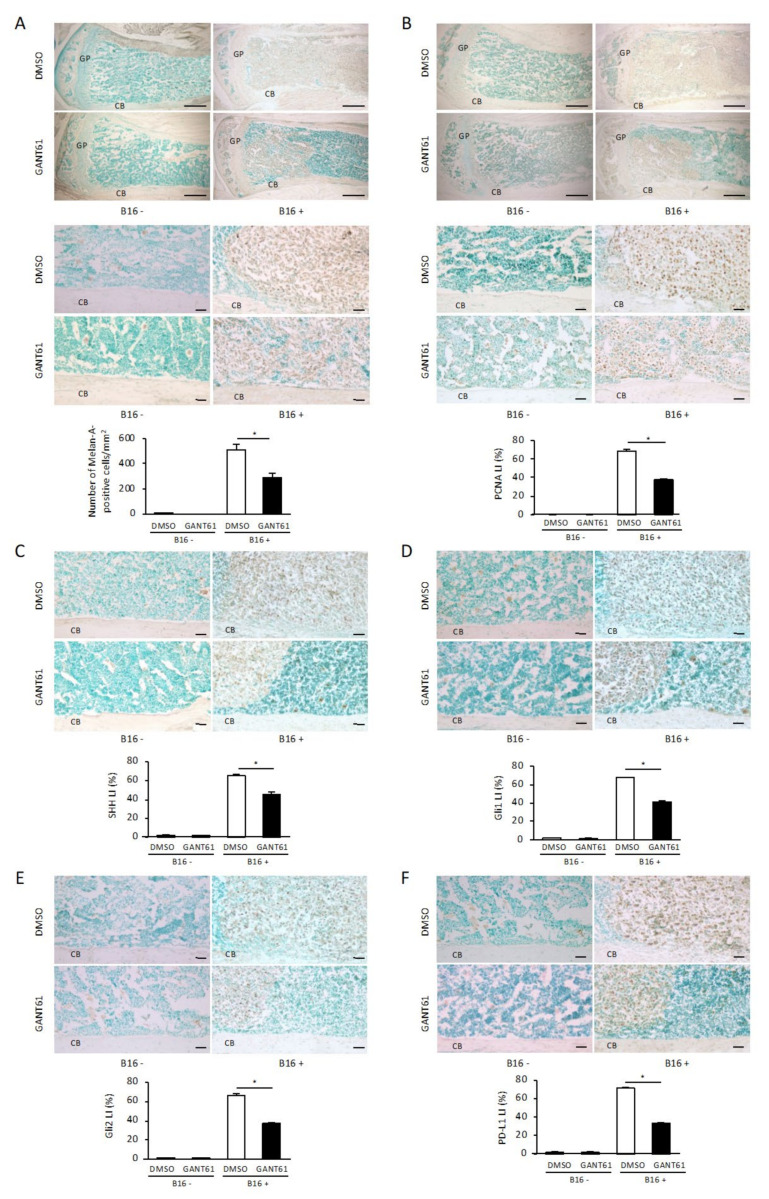
Figure 3.
Immunohistochemical analysis of Melan-A, proliferating cell nuclear antigen (PCNA), SHH, Gli1, Gli2, and PD-L1 in bone from mice bearing B16 melanoma cells. (A,B) Melan-A (A) and PCNA (B) expression in the tibial metaphysis with (right) or without (left) B16 cell inoculation and treated with DMSO (upper) or GANT61 (lower). Each image is a magnification of the typical cortical bone area (lower parts) of the corresponding upper part images in panels (A,B). Scale bar: 500 µm (upper part). Scale bar: 50 µm (lower part). The number of Melan-A-positive tumor cells per mm2 ((A), graph, n = 5/group). The percentage of PCNA-positive cells/Melan-A-positive tumor cells per mm2 (n = 5). (C–F) The expressions of SHH (C), Gli1 (D), Gli2 (E), and PD-L1 (F) in a typical cortical bone area in tibial metaphyses with (right) or without (left) B16 cell inoculation and treated with DMSO (upper) or GANT61 (lower). Scale bar: 50 µm. The percentages of SHH (C), Gli1 (D), Gli2 (E), and PD-L1 (F)-positive cells/Melan-A-positive tumor cells per mm2 (n = 5). Data are presented as mean ± SD. CB: cortical bone. LI: labeling index. * p < 0.05 between the indicated groups.

