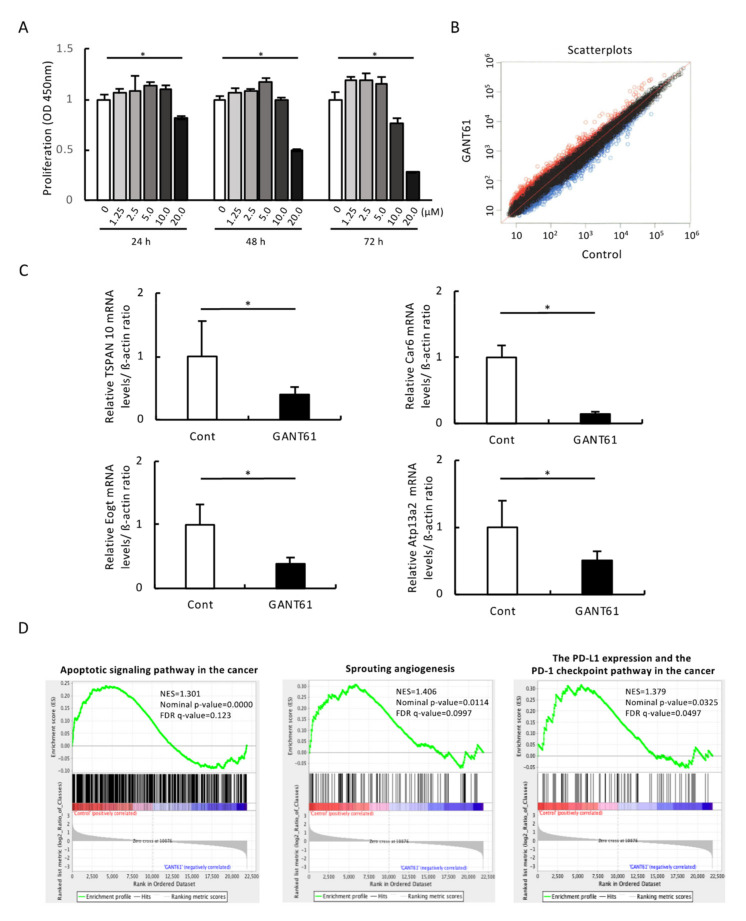
Figure 4.
In vitro characterization of GANT61’s effects on B16 cells. (A) The effect of GANT61 on the proliferation of mouse B16 melanoma cells. Cell proliferation was quantified using a microplate reader measuring the absorbance of the dye solution at 450 nm (n = 4). * p < 0.05 between the indicated groups. (B) Scatterplots representing the expression of genes in B16 cells exposed to 20 µM of GANT61 for 48 h. x-axis: the relative normalized log2-signal intensity of the control (not exposed to GANT61) samples. y-axis: the normalized log2-signal intensity of the samples exposed to GANT61. (C) Expression changes in the 4 genes that are most downregulated by exposure to GANT61. The genes TSPAN 10, Car6, Eogt, and Atp13a2 were analyzed using real-time RT-PCR (n = 5, * p < 0.05). β-actin was used as an endogenous control in these protocols. (D) The gene ontology biological process (GOBP) results of the gene set enrichment analysis (GSEA) of GANT61-treated B16 melanoma cells. Apoptotic signaling pathway in the cancer—GSEA statistics: normal enrichment score (NES) of 1.301, nominal p-value of 0.0000, and FDR q-value of 0.123. Sprouting angiogenesis— GSEA statistics: NES of 1.406, nominal p-value of 0.0114, and FDR q-value of 0.0997. The PD-L1 expression and the PD-1 checkpoint pathway in the cancer—GSEA statistics: NES of 1.379, nominal p-value of 0.0325, and FDR q-value of 0.0497.

