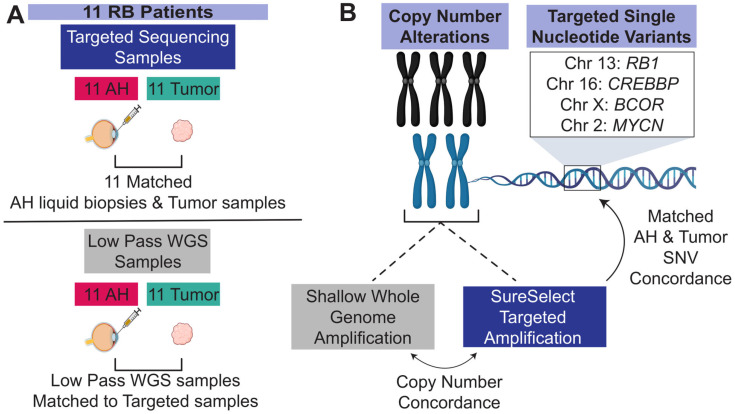
Figure 1.
Schematic of study design. (A) Eleven patients were present in the cohort. ((A) Top) Sample counts for each biospecimen collected that was processed through the dual-targeted SNV and SCNA methods are displayed. Eleven patients contained matched AH and tumor-targeted sequencing samples. ((A) Bottom) Sample count of low-pass WGS sequencing samples. (B) SCNAs from the SureSelect Targeted Sequencing approach were compared to the gold standard low-pass WGS, and concordance was calculated. The targeted reads were then used to call SNVs, and the 11 matched AH and tumor-targeted reads were directly compared for concordance. This figure was generated with BioRender.

