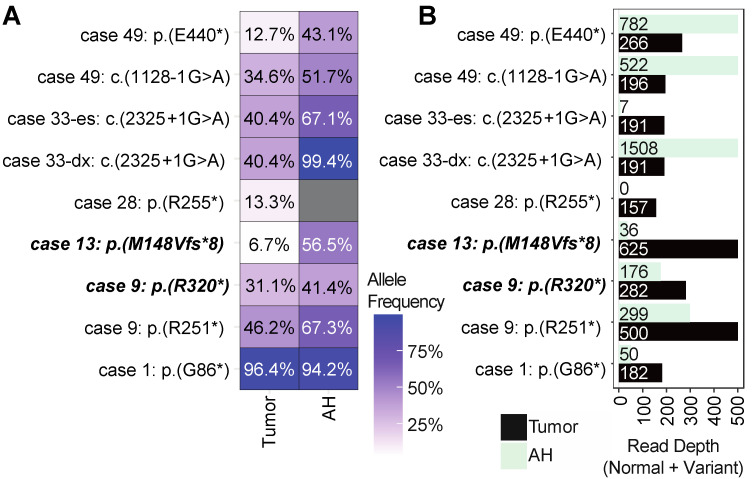
Figure 3.
SNV landscape of RB patients: (A) Allele frequency plot for deleterious SNVs detected to the RB1 gene. Case 33 had two AH samples (pt33-dx and pt33-es) but had a single tumor sample that was taken at enucleation. Cases that are bold and italicized are germline variants. Cases with asterisk (*) indicate nonsense variants that result in truncated protein. Dark grey boxes indicate the variant was not found in that sample. (B) Read depth for each genomic site in (A). Depth accounts for total reads at each specified site, including both variant reads and normal allele reads. X-axis for depth was cut off at 500 bases for legibility.

