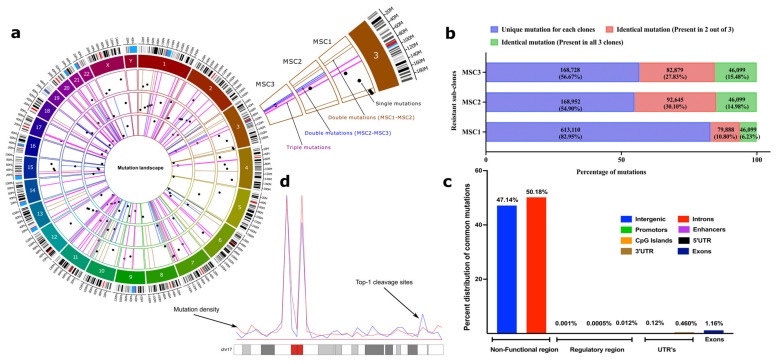
Figure 2.
SN-38-resistant subclones harbor identical mutations in their genomes in non-coding regions. (a) Circos plot to represent the category of mutations based on their occurrence in three independent clones. Three circles inside the chromatogram notations represent three individual selected resistant clones (MSC1, MSC2, and MSC3 from outside to inside). Dots (black) inside the respective circles represent mutations that are unique in the clones and not overlapping with others. Bars (brown) represent the overlapping mutations in clones MSC1 and MSC2. Bars (blue) represent the overlapping mutations in clones MSC2 and MSC3. Bars (pink) represent mutations that are overlapping in all three clones. Only 50 mutations of each category were chosen randomly and plotted for visualization purposes to their genomic locations. The plot was prepared using a commercial license from OMGenomics (Circa, RRID:SCR_021828) application. (b) The total quantification of overlapping mutations in the SN-38-resistant clones that emerge in the adaptation process. Stack graph showing the overlapping mutations among resistant sub-clones. Mutations in the resistant clones that differ from SCC1 were compared to each other. These mutations represent three categories: (blue) mutations that are unique to each clone and not found in other clones, (red) mutations that are identical in two clones, and (green) mutations that are identical in all three clones. (c) Categorical distribution of mutations to the non-functional, regulatory and UTR region of genome computed from annotation using SnpEff. (d) An example representation of chromosome 17 showing overlapped mutation density (blue line) and Top-1 cleavage sites (red line).

