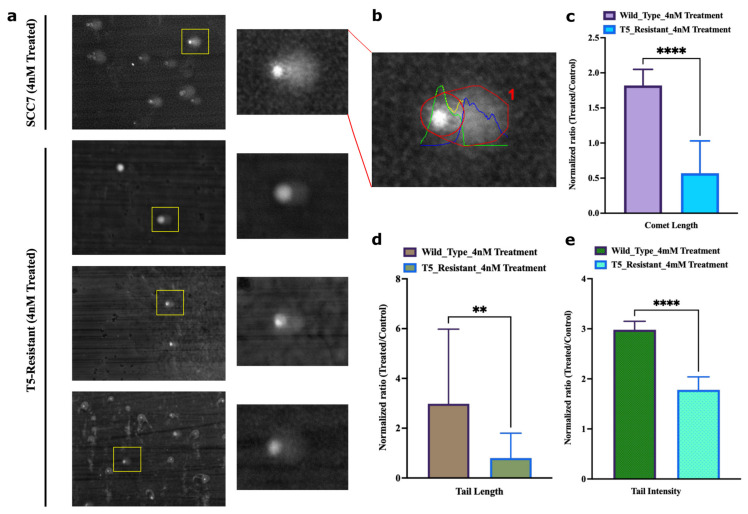
Figure 7.
Adapted population experiences lower frequency of overall breaks following SN-38 exposure. (a) Representative image of the field of SCC7 cells treated with SN-38 (24 h) and corresponding comets, imaged at 20× magnification, scale at 12.5 µm. Insert shows enlarged image of the comet. Lower three images with inserts show representative images of the adapted population. (b) Representative of quantified output image used to compute parameters for comet analysis. (c) Comet length and (d) comet tail length. (e) Intensity of DNA in tail was estimated using OpenComet v1.3.1. Bar plot represents normalized ratio of treated and control comets in SCC7 and T5-adapted cells separately. Statistics were calculated as mean of n = 21 comets in each using GraphPad Prism version 9.0.0, California, USA. The significance of differences was determined using unpaired Welch’s correction and two-tailed t-test (** p < 0.0021, **** p < 0.0001), as denoted in above figures (c–e).

