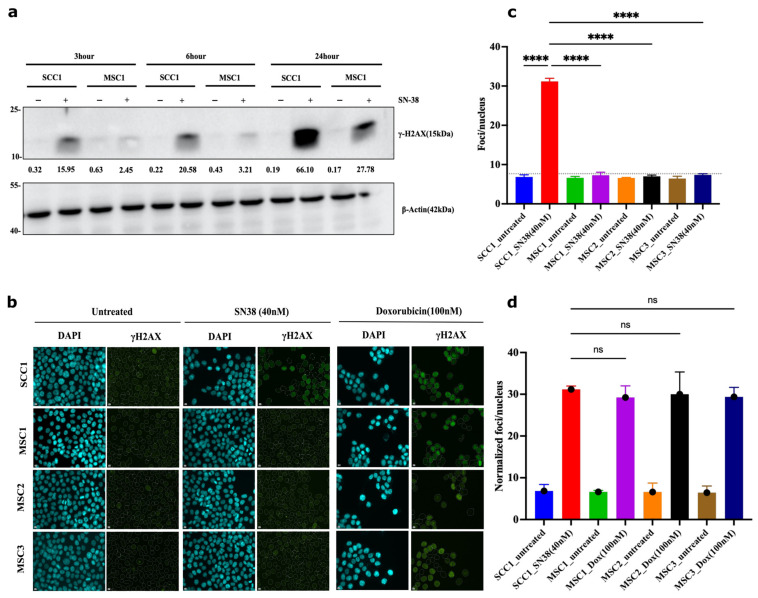
Figure 8.
Mutants experience lower frequency of DSB following SN38 exposure. (a) γH2AX foci in cells exposed to SN38 (40 nM for 30 min). After 3, 6, and 24 h, cells were harvested and lysed for immunoblot for quantification of phosphorylated H2AX levels, as shown. Experiment was conducted in biological duplicates (n = 2). (b) SCC1 cells are compared to the mutant clones using γH2AX foci quantification for 24 h treatment observing significant differences based on immunoblot phosphor-H2AX levels. We observe consistent increases in protein levels with highest expression for SCC1 at 24 h. Experiment was conducted in biological triplicates (n = 3). (c) Quantification of SN-38-generated foci presented in (b) showing significant decrease in foci generation in resistant mutants. n = 228 images were analyzed with the integrated software (refer to Section 4); for short-term treatment (30 min data) and foci quantification, refer to Figure S8. Quantification for doxorubicin cell sensitivity is presented in Figure S9. Statistics were calculated using GraphPad Prism version 9.0.0, California, USA. The significance of differences was determined using unpaired Welch’s correction and two-tailed t-test (ns < 0.1234, **** p < 0.0001), as denoted in above in figure (c). Pseudo-color is used in DAPI for visualization purposes. Controls in (c,d) are the same.

