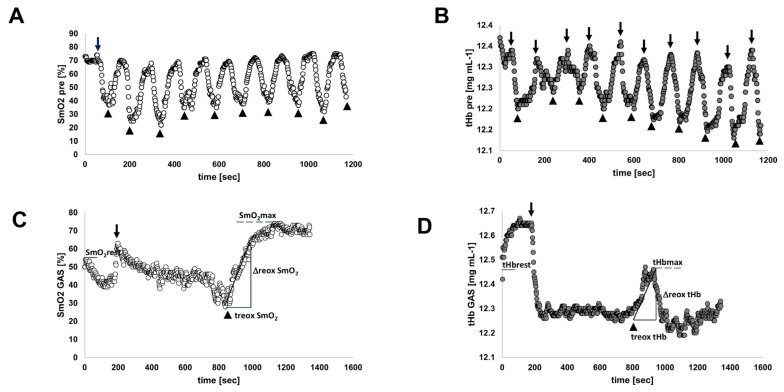
Figure 1.
Perfusion-related muscle metabolism during interval and ramp exercise. Scatter plot of examples of oxygen saturation (A) and tHb concentration (B) in GAS muscle during interval exercise. (C,D) Oxygen saturation (C) and tHb concentration (D) in one subject during the ramp exercise to exhaustion before training. Pedaling started at 200 s and stopped near 834 s. The extracted parameters are exemplarily indicated in (C,D). Arrows and arrowheads denote the start and end, respectively, of pedaling.

