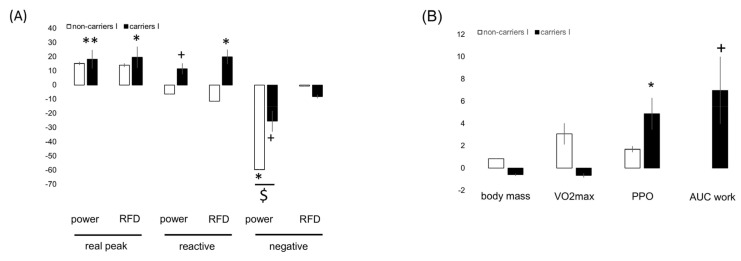
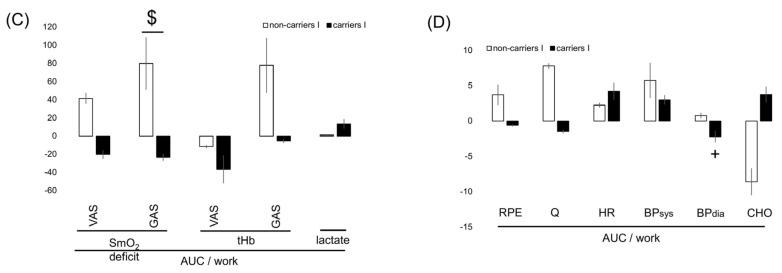
Figure 2.
Interval training-induced effects on physiological performance characteristics between genotypes. Bar graph of the mean ± SD of interval training-induced effects (i.e., after vs. before 8 weeks of interval-type training) between ACE-I/D genotypes for parameters characterizing muscle performance (A), aerobic capacity (B), aerobic muscle metabolism (C), and cardiovascular function (D) during incremental exercise. Note the antidromic influence of interval type training between the ACE I/D genotypes for I-allele carriers vs. no I-allele carriers for the situation post- versus pre-. +, p < 0.10; *, ** p < 0.05 and 0.01. $,  p < 0.05. (for post- vs. pre-, meaning pre- versus post-training intervention).


