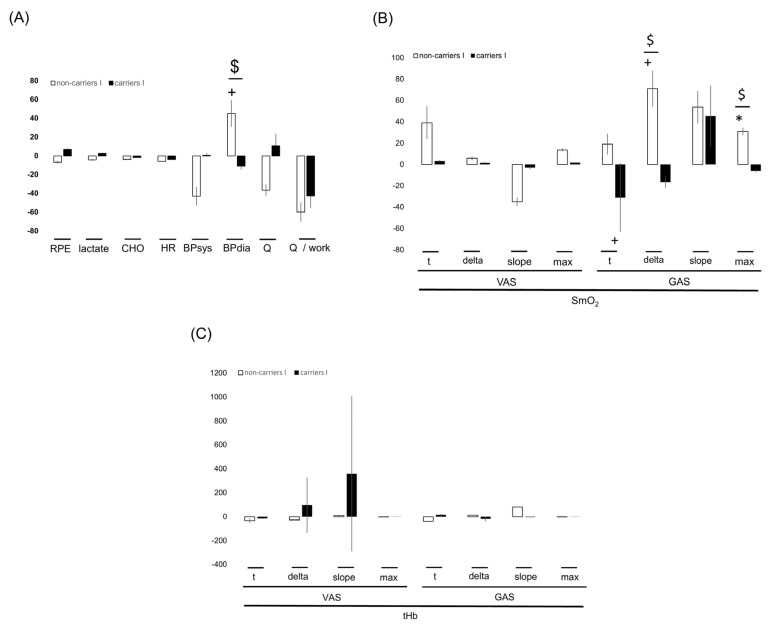
Figure 5.
ACE genotype difference for interval training-induced effects on recovery of cardiac function post-exercise. Bar graph of the mean ± SD of interval training-induced effects per ACE-I/D genotype (i.e., after vs. before 8 weeks of interval-type training) for parameters characterizing recovery of cardiac function (A) and muscle metabolism (i.e., SmO2, (B); tHb, (C)) after incremental ramp exercise. Note the influence of interval type training between the ACE I/D genotypes for diastolic blood pressure, which runs antidromic to the influence on systolic blood pressure and the antidromic influence of interval type training between the ACE I/D genotypes for muscle oxygenation in GAS. +, p < 0.10; *, p < 0.05. $,  p < 0.05 I vs. no I (for post- vs. pre-, meaning pre- versus post-training intervention).

