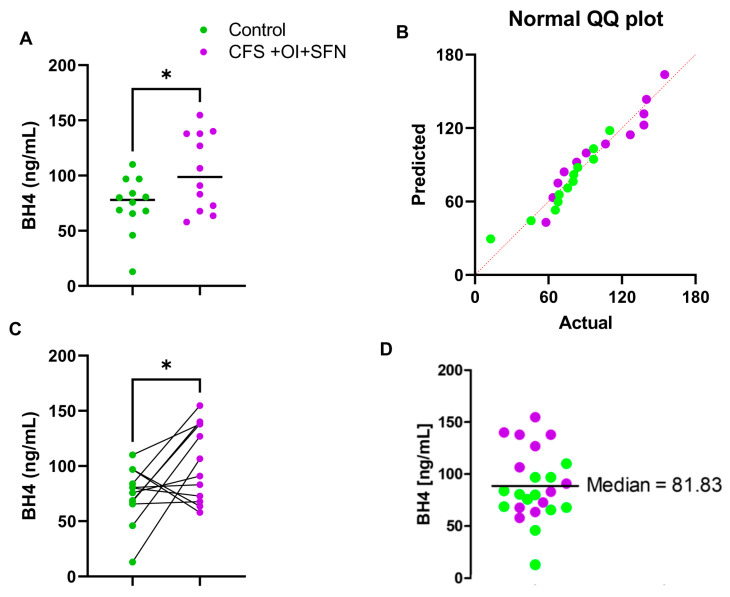
Figure 3.
Assessment of difference in BH4 levels between control and CFS + OI + SFN subjects. (A) A competitive BH4 ELISA assay in 1:2 diluted serum samples of n = 12 CFS + OI + SFN (purple) and n = 12 age-/gender-matched control (n = 12) subjects. The significance of mean was tested by unpaired t-test between the two groups at * p < 0.05 (=0.0269). (B) Q-Q plot revealed normal distribution of all data points. (C) A gender- and age-based paired analysis of BH4 between control and CFS subjects. Paired t-test (* p < 0.05) confirmed that the CFS serum samples had significantly elevated BH4 compared with the control serum samples. (D) A scatter dot plot analysis was performed to test how many subjects had higher BH4 levels above the median BH4 concentration (81.83 ng/mL as indicated by a solid black line). Green dots are controls (n = 10), and purple dots are CFS + OI+SFN subjects (n = 12). SFN = small fiber polyneuropathy. Results are the mean of three different experiments.

