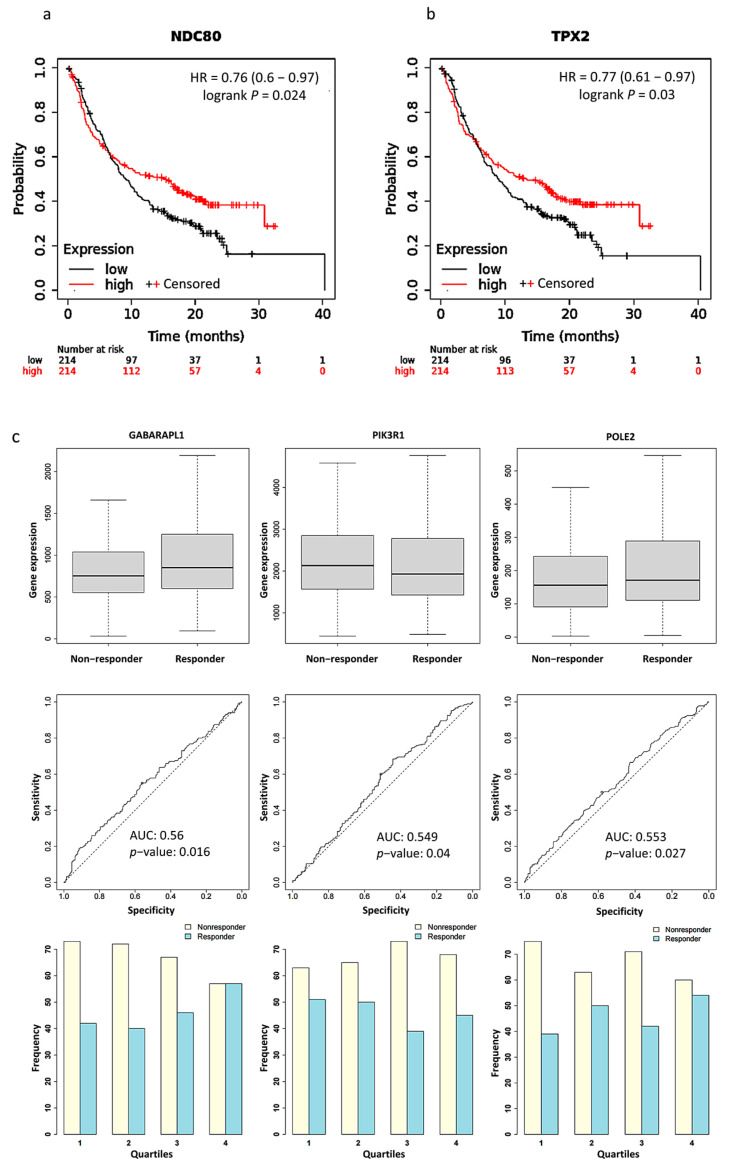
Figure 4.
Kaplan–Meier plots for the comparison of survival between high and low expression levels: (a) NDC80 (HR = 0.76, p = 0.024); (b) TPX2 (HR = 0.77, p = 0.03). (c) Boxplots, Receiver operating characteristic (ROC) curves, and responders’ frequency of top three genes in predicting PD-L1 inhibitor response: GABARAPL1 (AUC = 0.560, p = 0.016), PIK3R1 (AUC = 0.549, p = 0.04), and POLE2 (AUC = 0.553, p = 0.027); “o” indicates the strongest cutoff, which has the minimal distance from the ideal discriminator.

