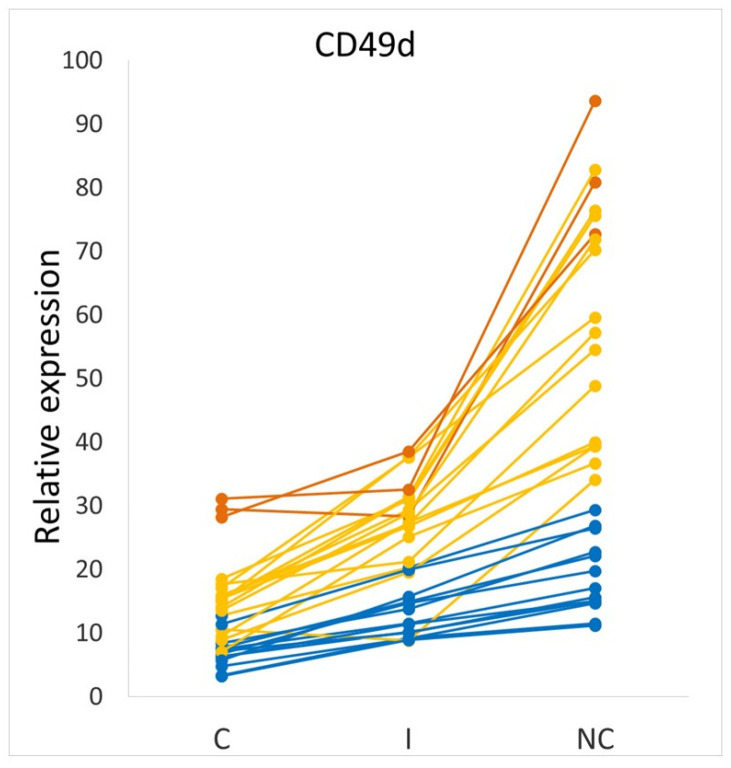
Figure 4.
Variation in CD49d between monocyte subsets for different study individuals. Each line on the graph is representative of the relative CD49d marker expression for one individual. Dark orange lines show study subjects with higher expression of CD49d on all three monocyte subsets than the nonclassical subset of the participants indicated by the blue lines. The remainder of the participants’ data is shown in yellow. C: Classical; I: intermediate and NC: nonclassical. The figure is adapted with permission from Patel et al. ‘Monocyte subset recruitment marker profile is inversely associated with blood ApoA1 levels’, Frontiers in Immunology 2021 [14]. Copyright 2021 Patel, Williams, Li, Fletcher, and Medbury.

