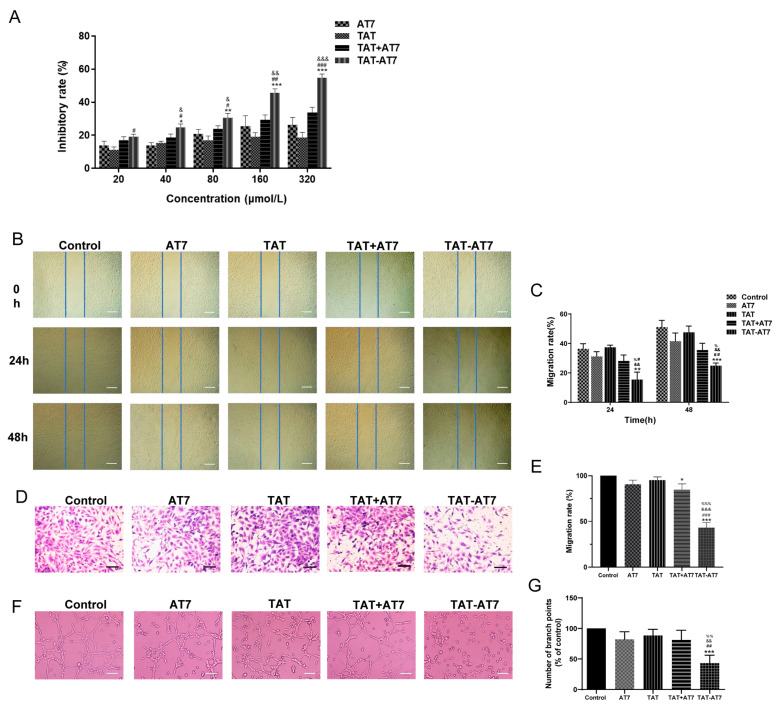
Figure 1.
Effects of TAT-AT7 on angiogenesis in vitro. (A) Inhibitory effect of AT7, TAT, TAT+AT7, and TAT-AT7 on HUVECs’ proliferation determined by the MTT assay. Each data point represents the mean ± standard deviation. n = 3, * p < 0.05, ** p < 0.01, *** p < 0.001 vs. AT7 group; # p < 0.05, ## p < 0.01, ### p < 0.001 vs. TAT group; & p < 0.05, && p < 0.01, &&& p < 0.001 vs. TAT+AT7 group. (B) AT7, TAT, TAT+AT7, and TAT-AT7 were incubated with HUVECs for 48 h, and the cell migration was photographed under an inverted microscope at 0 h, 24 h, and 48 h, respectively. Bars represent 200 μm. (C) Statistical migration rates. (D) Different groups of peptides were incubated with HUVECs for 24 h, and the cell invasion was photographed under an inverted microscope. Bars represent 60 μm. (E) Statistical invasion rates. (F) HUVECs were treated with AT7, TAT, TAT+AT7, and TAT-AT7 for 6 h, and the tubular structure formation of HUVECs was photographed under an inverted microscope. Bars represent 50 μm. (G) Statistical total branching length of tubular structures. Each data point represents the mean ± standard deviation. n = 3, * p < 0.05, ** p < 0.01, *** p < 0.001 vs. control group; # p < 0.05, ## p < 0.01, ### p < 0.001 vs. AT7 group; && p < 0.01, &&& p < 0.001 vs. TAT group; % p < 0.05, %% p < 0.01, %%% p < 0.001 vs. TAT+AT7 group.

