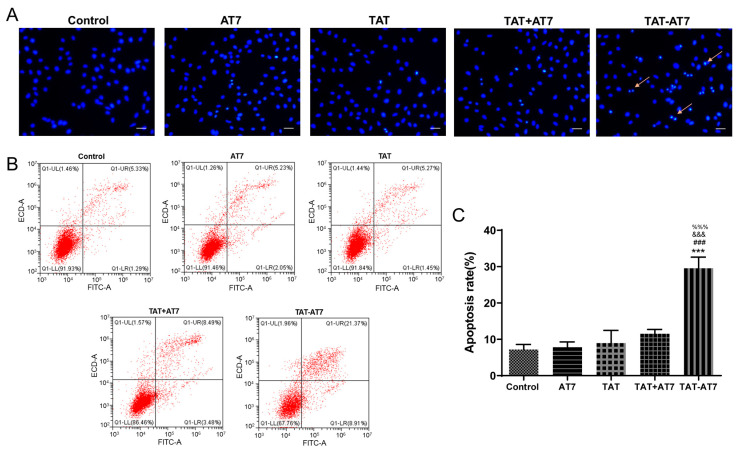
Figure 2.
Effect of TAT-AT7 on apoptosis of HUVECs. (A) Fluorescence images of HUVECs stained with Hoechst 33,258. Arrows represent the apoptotic cells. Bars represent 50 μm. (B) Flow cytometry analysis of apoptosis using Annexin V and PI staining. The late apoptosis cells were indicated as Q1-UR, and the early apoptosis cells were indicated as Q1-LR. (C) The total rate of apoptosis of cells (Q1-UR and Q1-LR). Each data point represents the mean ± standard deviation. n = 3, *** p < 0.001 vs. control group; ### p < 0.001 vs. AT7 group; &&& p < 0.001 vs. TAT group; %%% p < 0.001 vs. TAT+AT7 group.

