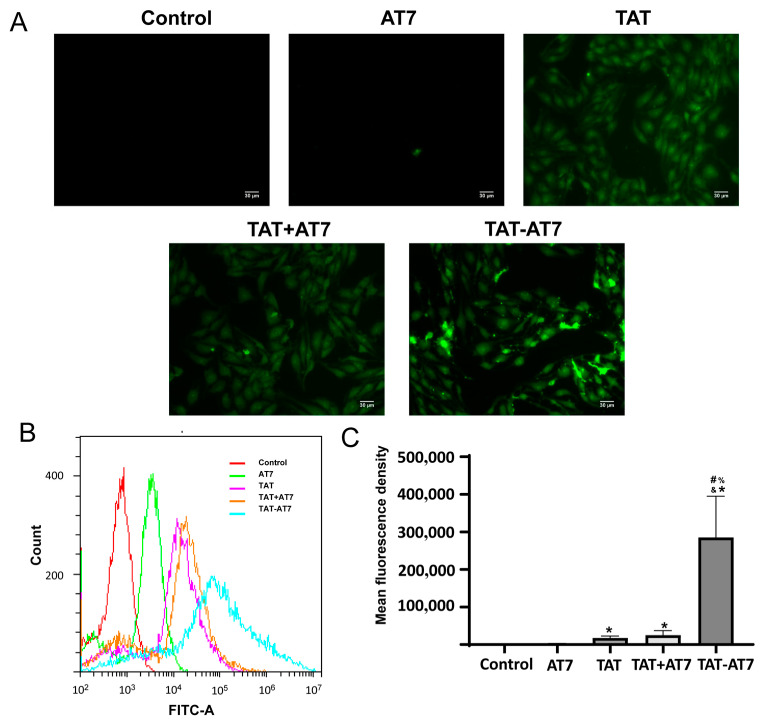
Figure 6.
The cellular uptake of TAT-AT7 by bEnd3 cells. (A) The FITC-labeled AT7, TAT, and TAT-AT7 were incubated with bEnd3 cells for 1 h, and the fluorescent uptake of peptides by bEnd3 cells was determined under a fluorescence microscope. Bars represent 30 μm. (B) Flow cytometric histogram profiles of fluorescence intensity. (C) The statistical mean fluorescence intensity. Each data point represents the mean ± standard deviation. n = 3, * p < 0.05 vs. control group; # p < 0.05 vs. AT7 group; & p < 0.05 vs. TAT group; % p < 0.05 vs. TAT+AT7 group.

