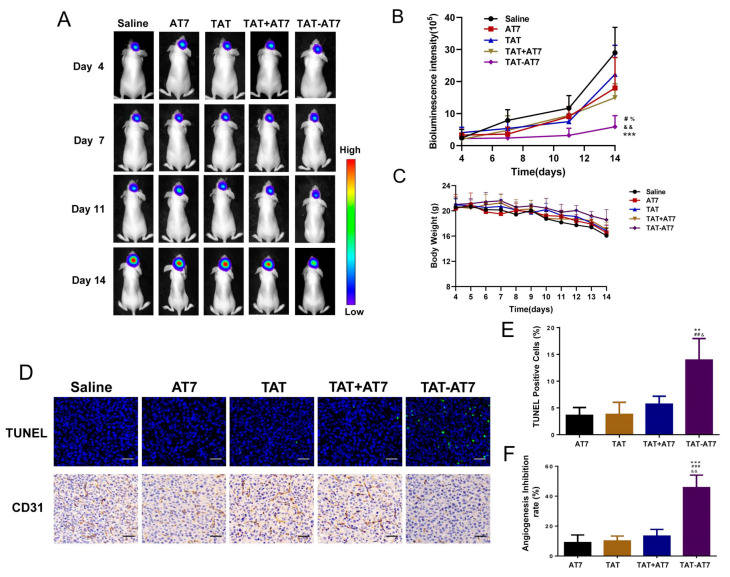
Figure 10.
TAT-AT7 inhibited the growth of glioma in nude mice. Normal saline, AT7, TAT, TAT+AT7, and TAT-AT7 were injected into intracranial U87-mCherry-luc glioma-bearing mice daily via the tail vein for 11 consecutive days. (A) The bioluminescence images were visualized by the IVIS imaging system on days 4, 7, 11, and 14. Each data point represents the mean ± standard deviation. n = 5, *** p < 0.001 vs. control group; # p < 0.05 vs. AT7 group; && p < 0.01 vs. TAT group; % p < 0.05 vs. TAT+AT7 group. (B) Statistical results of glioma bioluminescence intensity. (C) Body weight changes. (D) TUNEL and CD31 staining were performed on glioma tissue sections to observe cell apoptosis and MVD. Bars represent 100 μm. (E) Quantification of TUNEL-positive cells. (F) Quantification of angiogenesis inhibition rate. Bars represent 100 μm. Each data point represents the mean ± standard deviation. n = 3, ** p < 0.01, *** p < 0.001 vs. AT7 group; ##p < 0.01, ### p < 0.001 vs. TAT group; & p < 0.05, && p < 0.01 vs. TAT+AT7 group.

