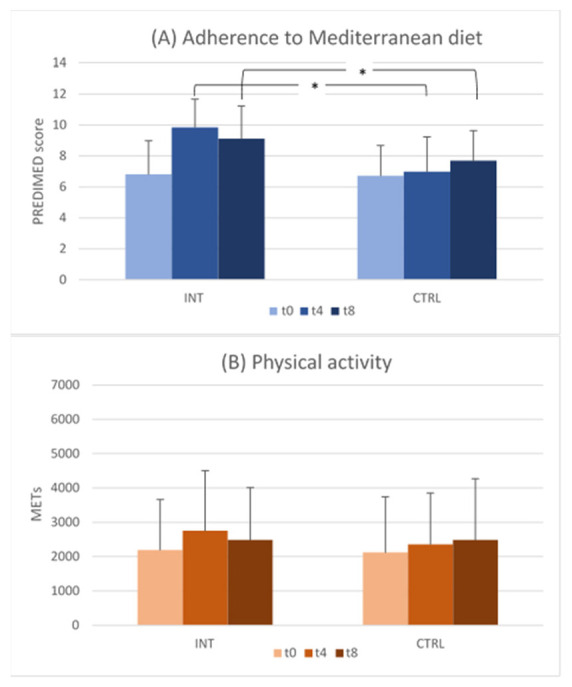
Figure 2.

Mean score and S.D. of adherence to (A) Mediterranean diet (PREDIMED questionnaire) and (B) physical activity (IPAQ questionnaire) in the intervention (INT) and control (CTRL) groups, at baseline (t0), end of intervention (t4), and end of follow-up (t8). For PREDIMED, at t0 and t4, INT: N = 66 and CTRL: N = 63. At t8, INT: N = 60 and CTRL: N = 53. For IPAQ, at t0 and t4, INT: N = 62 and CTRL: N = 61. At t8, INT: N = 53 and CTRL: N = 52. *: p < 0.001 for t0–t4 and t0–t8 comparisons between the INT and CTRL groups for the PREDIMED score; p > 0.05 for the t0–t4 and t0–t8 comparisons between the INT and CTRL groups for the IPAQ score in METs (ANCOVA).
